Power BI reports can be surfaced in several ways in Dynamics 365. In this post, we will look at the various options available today in 2024 to display Power BI reports inside of Dynamics 365.
Creating a Workspace
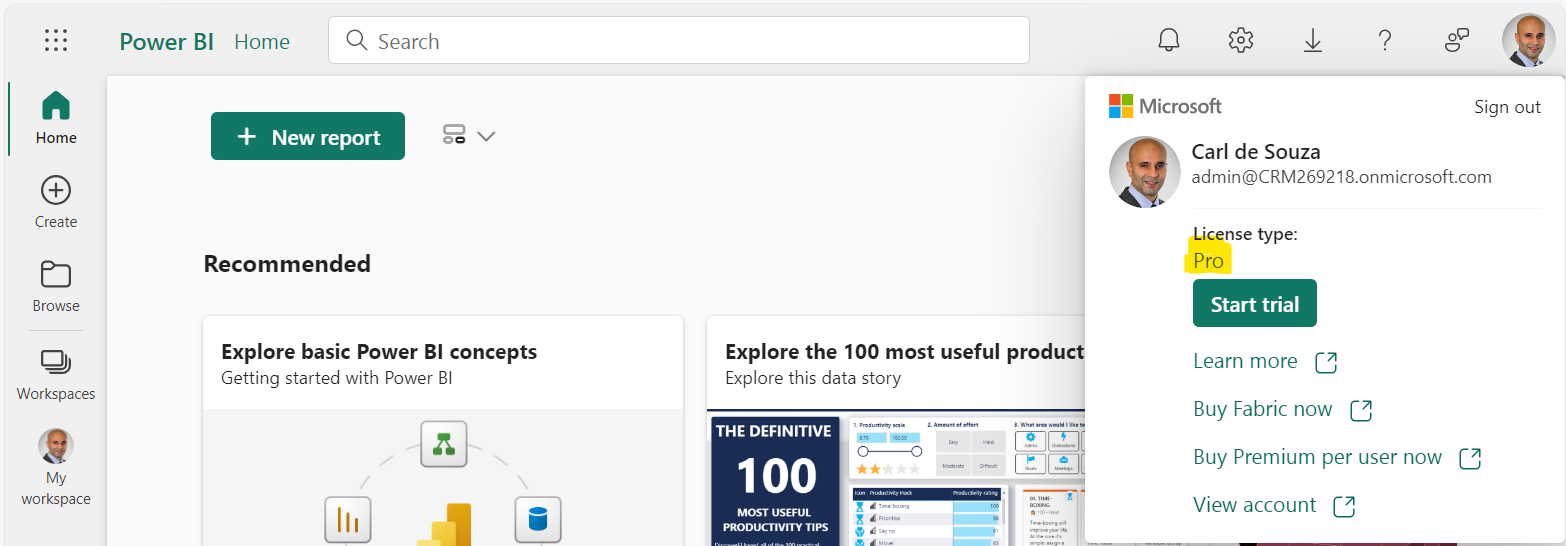
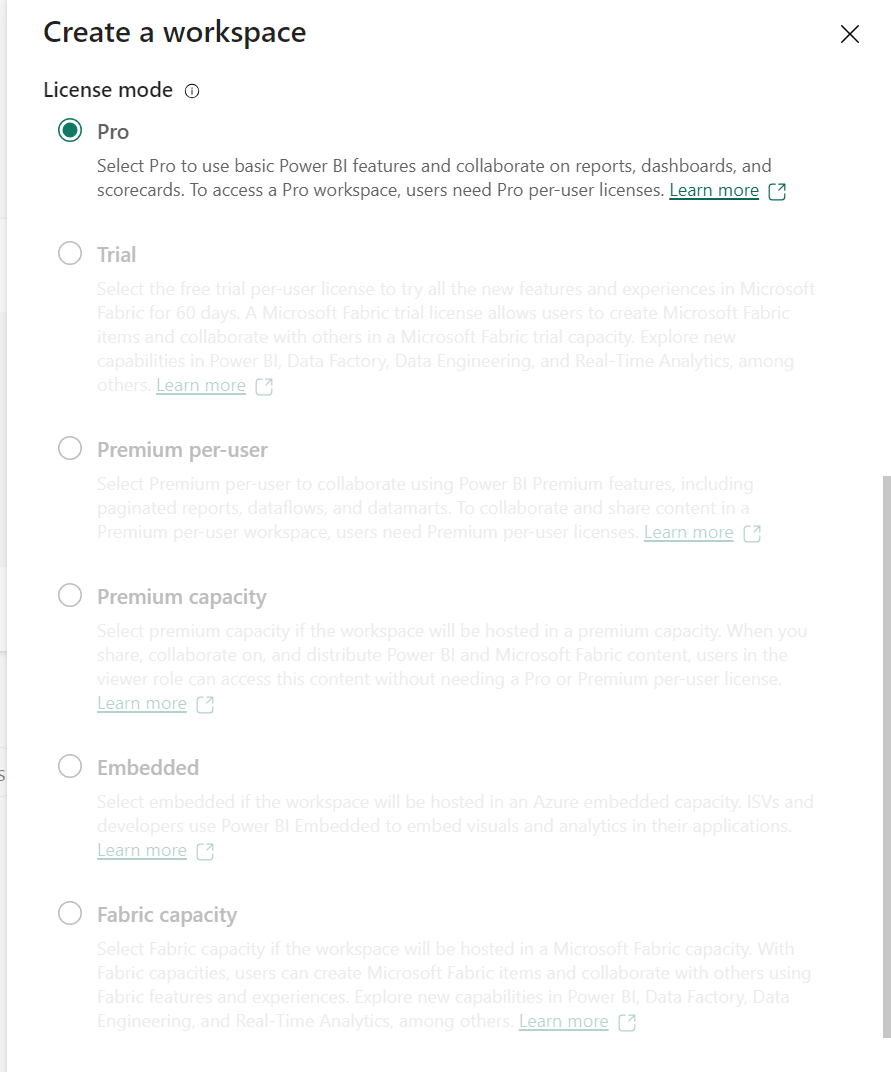
First, let’s go ahead and create a new Power BI workspace, where we will be housing our Power BI reports. This is done in the Power BI service at https://app.powerbi.com. When you’re in the service, you will be able to see your license type. You can see I have a Pro license (users of shared workspaces will need a Pro license or the workspace will need to be backed by Premium capacity):
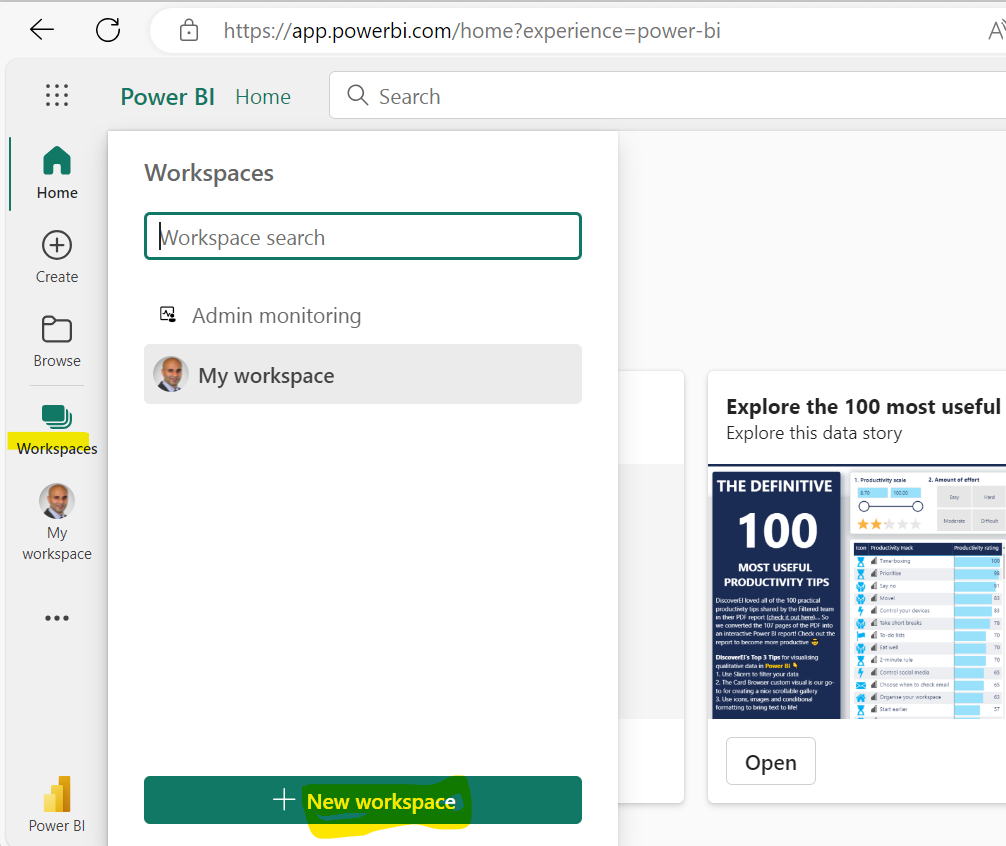
Let’s create a new Workspace:
We will call the workspace “Dynamics 365 Reports”. Here we will be able to add users who have access to the workspace, and select the license mode. We will add users a little later. For now, the license mode we will use is Pro.
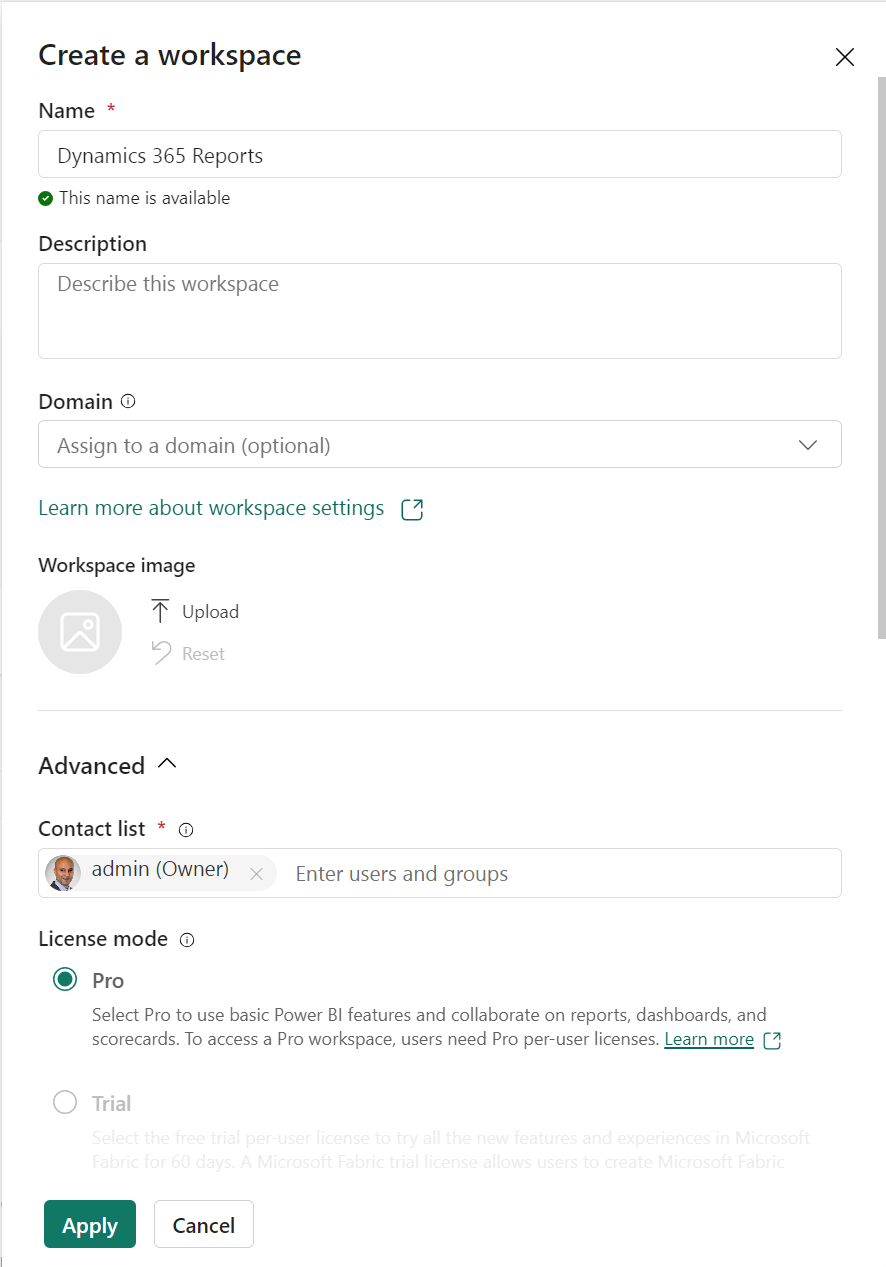
Click Apply.
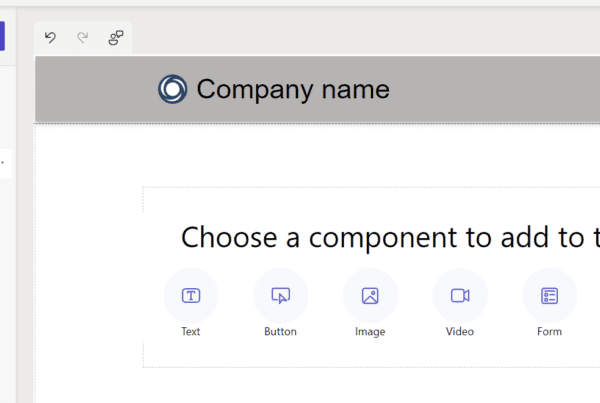
Now we can create our report. We see these options for New in the workspace, but we will be creating our report using Power BI Desktop:
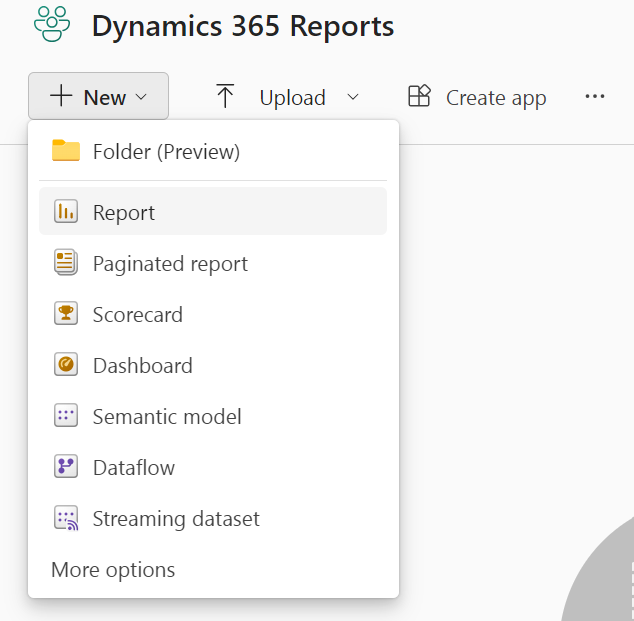
To explain Power BI Desktop vs the Power BI Service, the Desktop version is an authoring tool that you install on your PC to build reports. Once they are built, they can be shared with others by uploading them to a Power BI Service workspace and granting those users access.
The Power BI Desktop app can be downloaded here or through the Microsoft Store on your PC. Once downloaded, open the app.
There are a few ways to connect to get Dataverse data:
- Dataverse connector with TDS Endpoint
- Dataverse connector with Import
- Azure Synapse Link
- Link to Microsoft Fabric (see end of this post for more details)
Dataverse Connector with TDS Endpoint
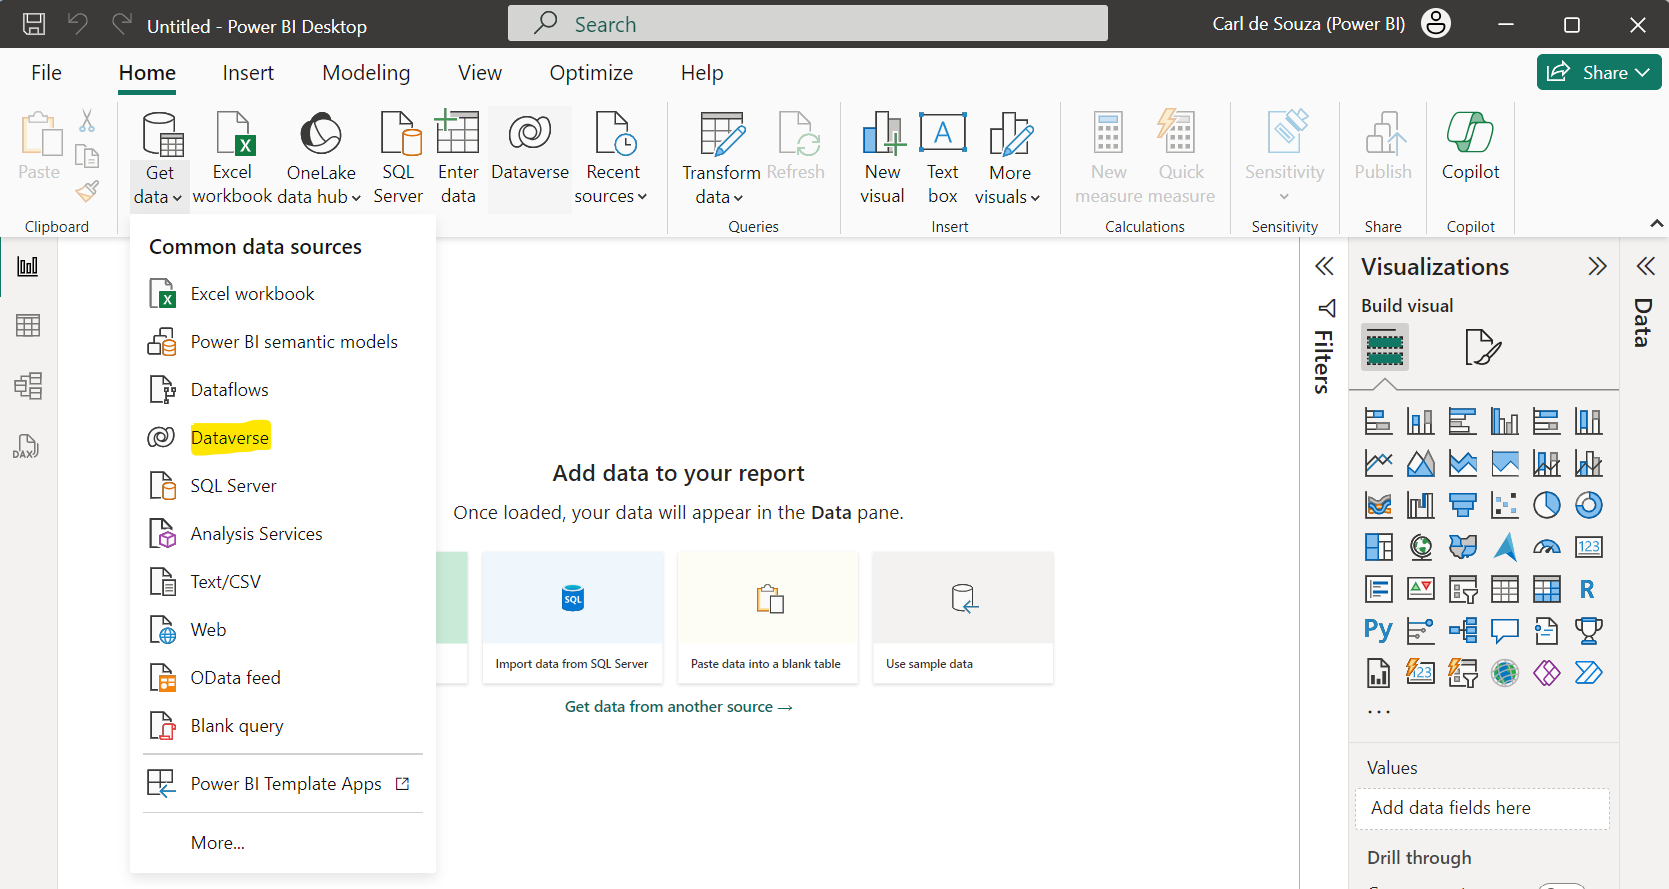
Let’s look at the Dataverse connector with TDS Endpoint first. Select Get Data and select Dataverse:
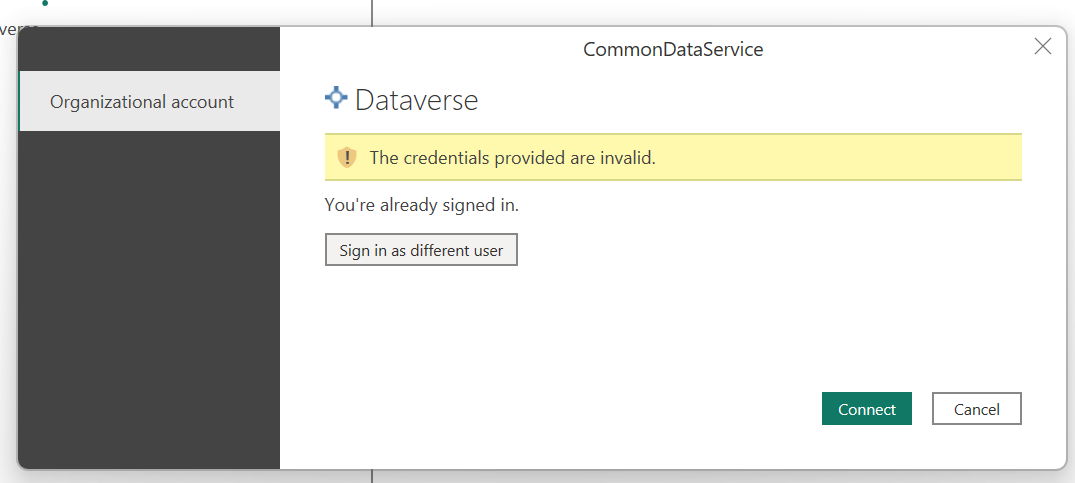
Enter in your Dynamics 365 credentials:
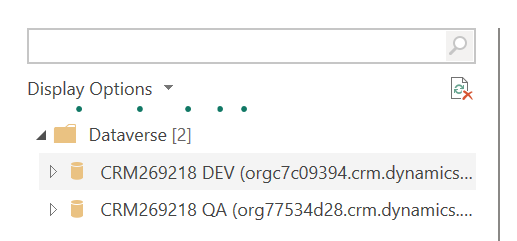
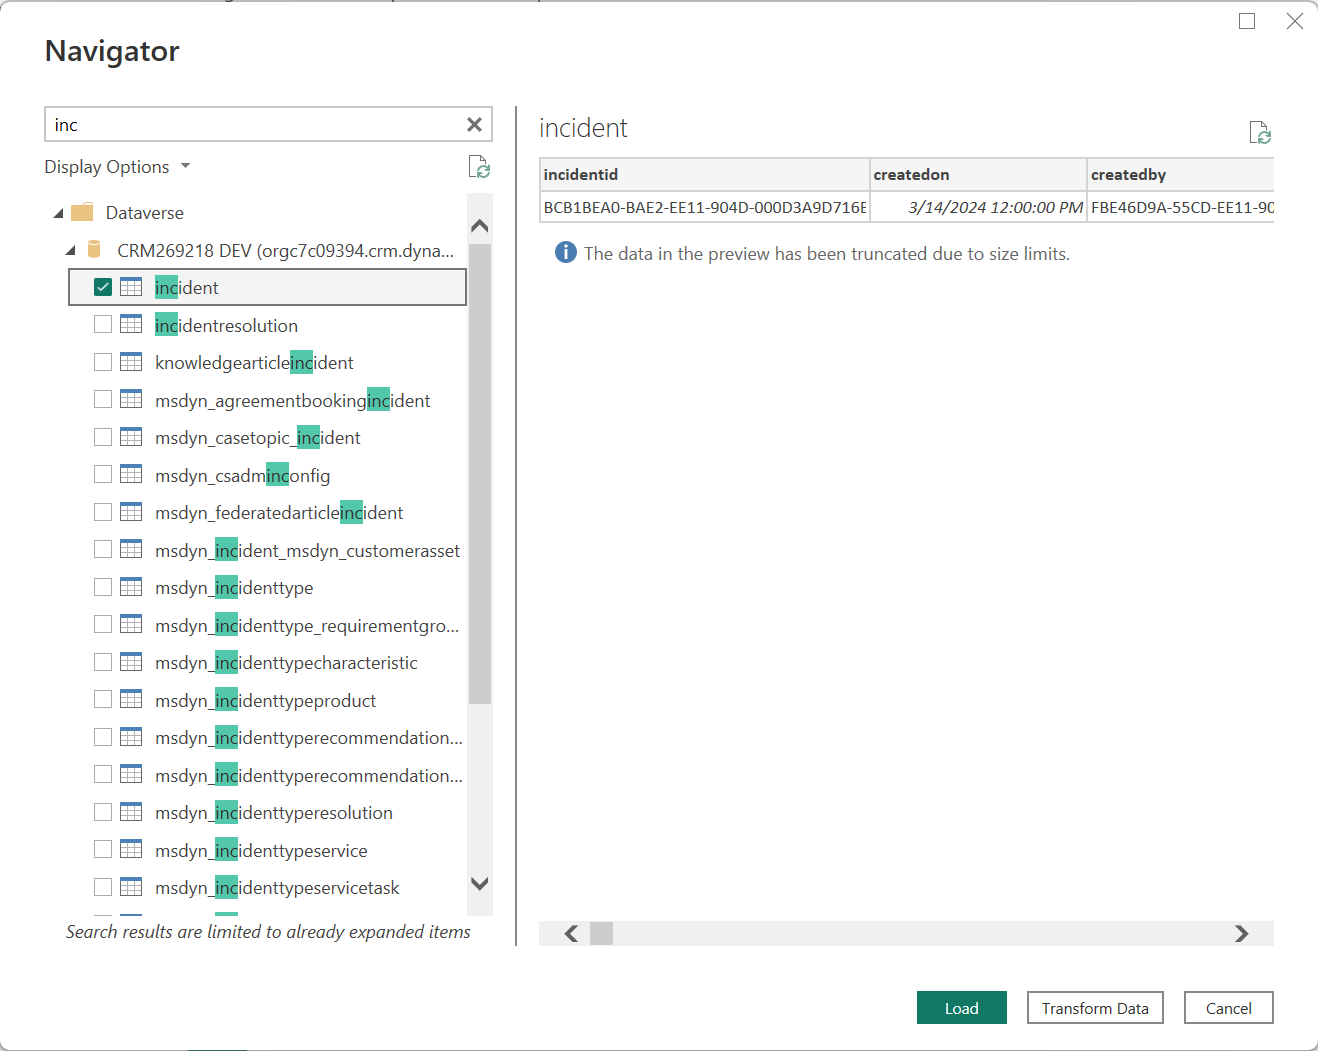
Expand your Org and then choose the tables you need on your report. Note you can add more tables later if you need to:
Select the tables and click Load or Transform Data. Load will bring the user to the report authoring canvas, and Transform Data opens the window to perform Power Query transformations. Whichever option you select you can choose the other one later. We will select Load:
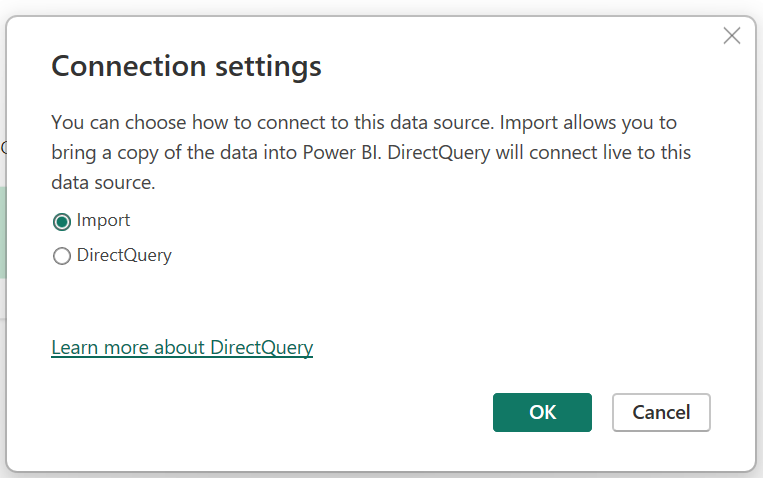
Here we have the option to either query the Dataverse directly (DirectQuery) or import the data:
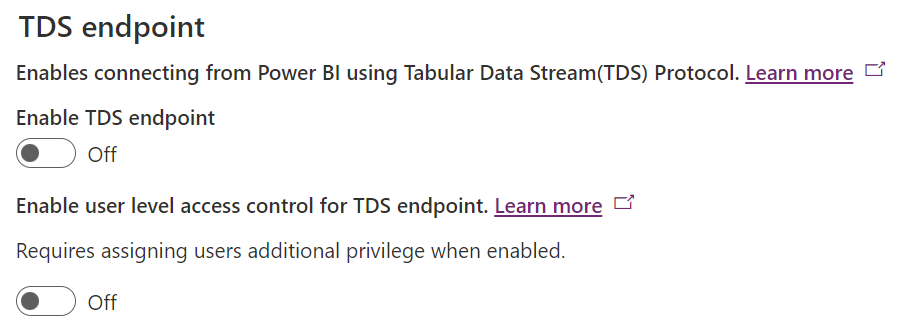
Now is a good time to pivot to the Power Platform Admin Center to look at some settings that we will need to configure. In the PPAC, go to Settings->Features and we will see TDS Endpoint:
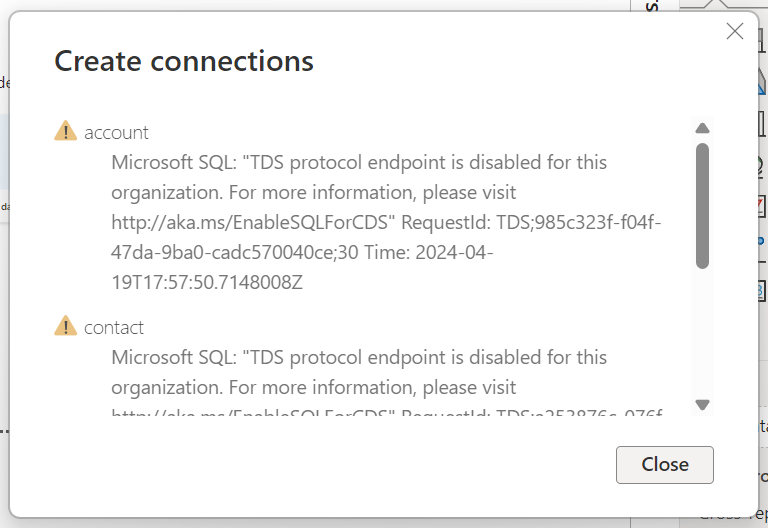
If we were to try to connect from Power BI Desktop using DirectQuery without enabling this we get the error “Microsoft SQL: “TDS protocol endpoint is disabled for this organization. For more information, please visit https://aka.ms/EnableSQLForCDS”:
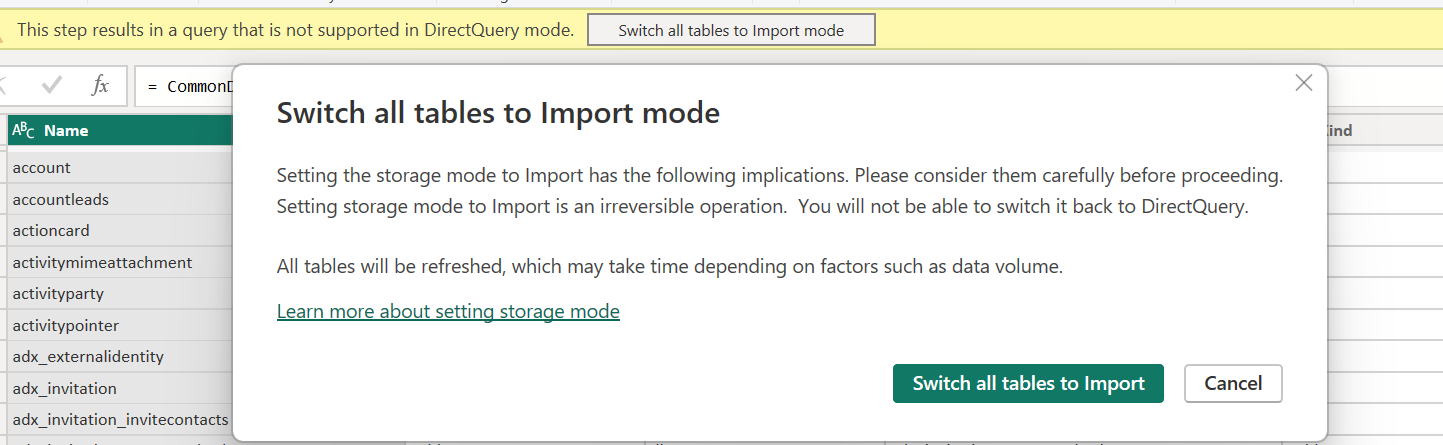
We can enable this on the server or “Switch all tables to Import mode”. Let’s enable on the server for this first test.
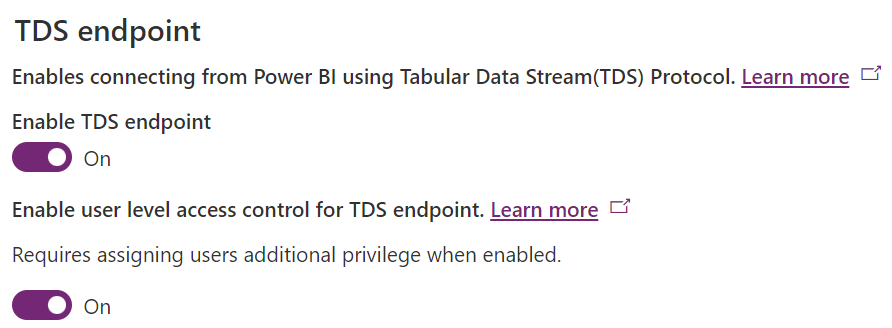
To enable, in the PPAC set the Enable TDS Endpoint to On. We will also set Enable user level access control for TDS endpoint. We will see how this comes into play shortly.
Make sure to click Save on the bottom right of the page.
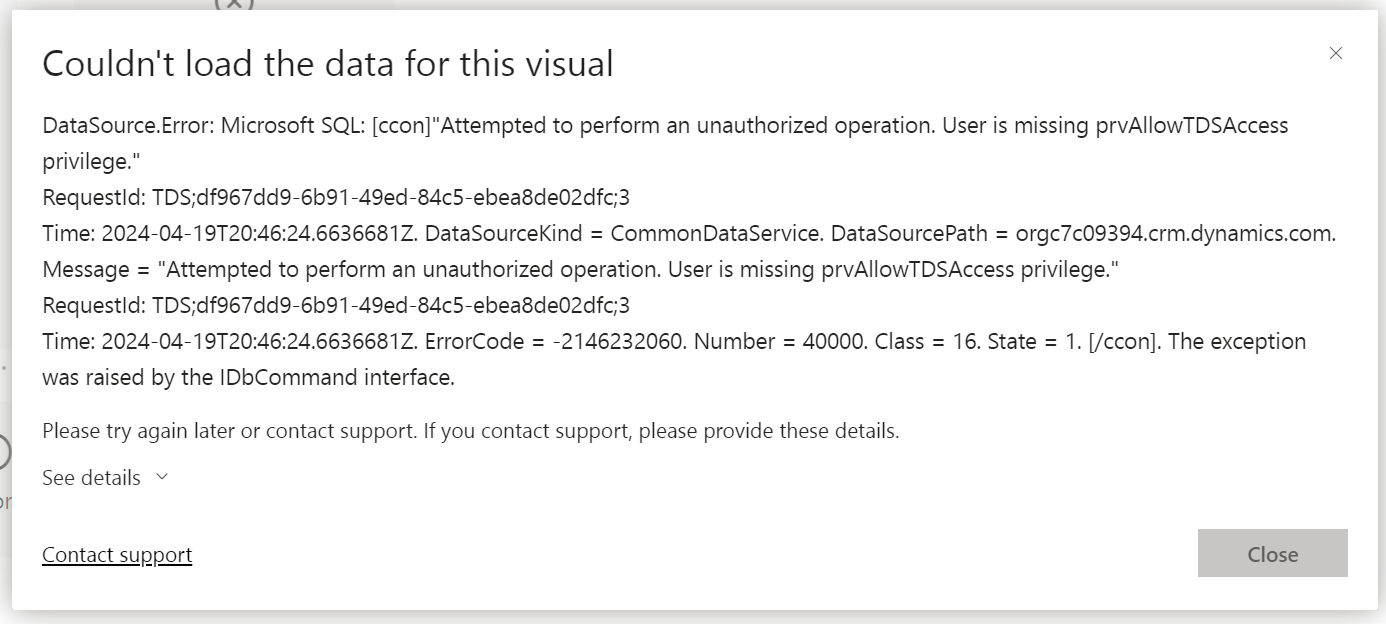
If you set Enable user level access control for TDS endpoint to On and a user accesses the report without the correct permissions, they will see this error – “DataSource.Error: Microsoft SQL: [ccon]”Attempted to perform an unauthorized operation. User is missing prvAllowTDSAccess privilege.”:
To correct this, the user needs the privilege “Allow user to access TDS endpoint”. Go to a security role, the select Miscellaneous Privileges->Show All privileges, and select Organization (which is the only option):
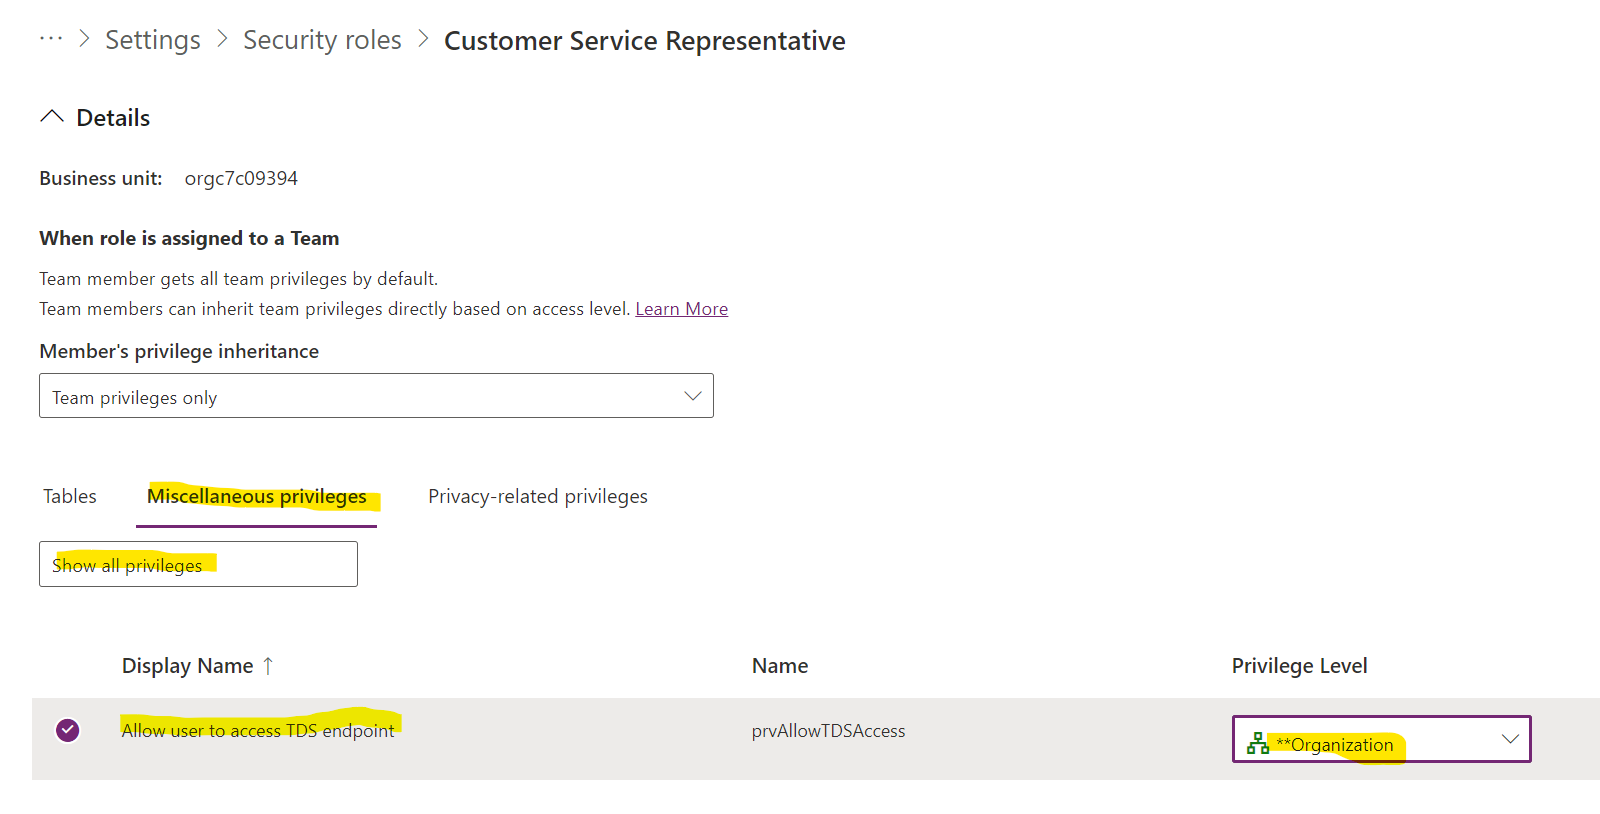
Save the role.
Now if we click Apply Changes on the report again, we will see our report is connected to our data:

Now, Power BI will try to detect the relationships in the data model. You can see the relationships it has detected by clicking the Model View here:
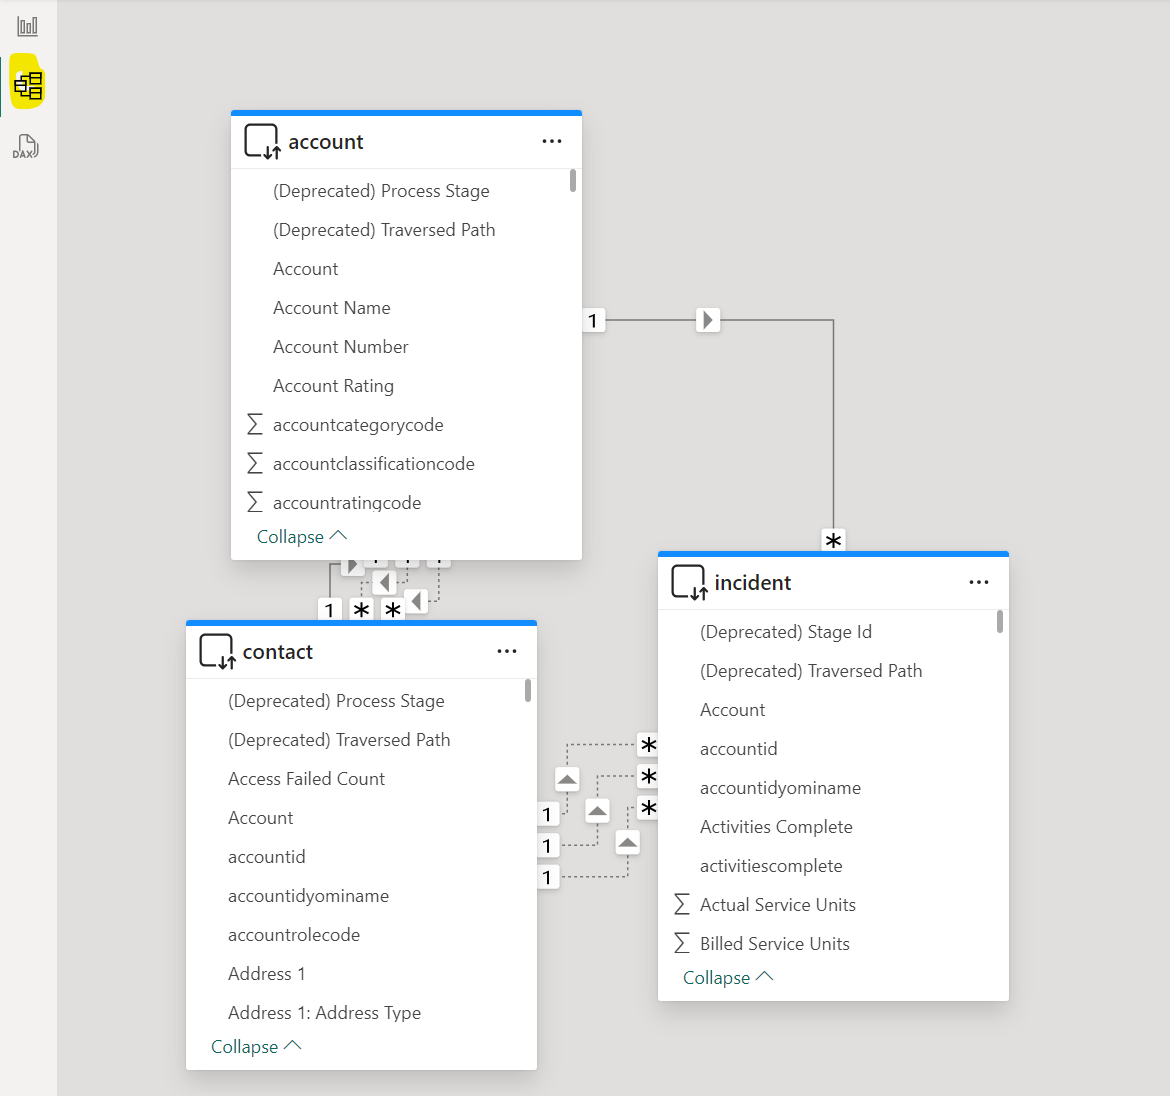
Sometimes these relationships aren’t accurate, and you will need to double click on each relationship and correct it or change it in the Properties:
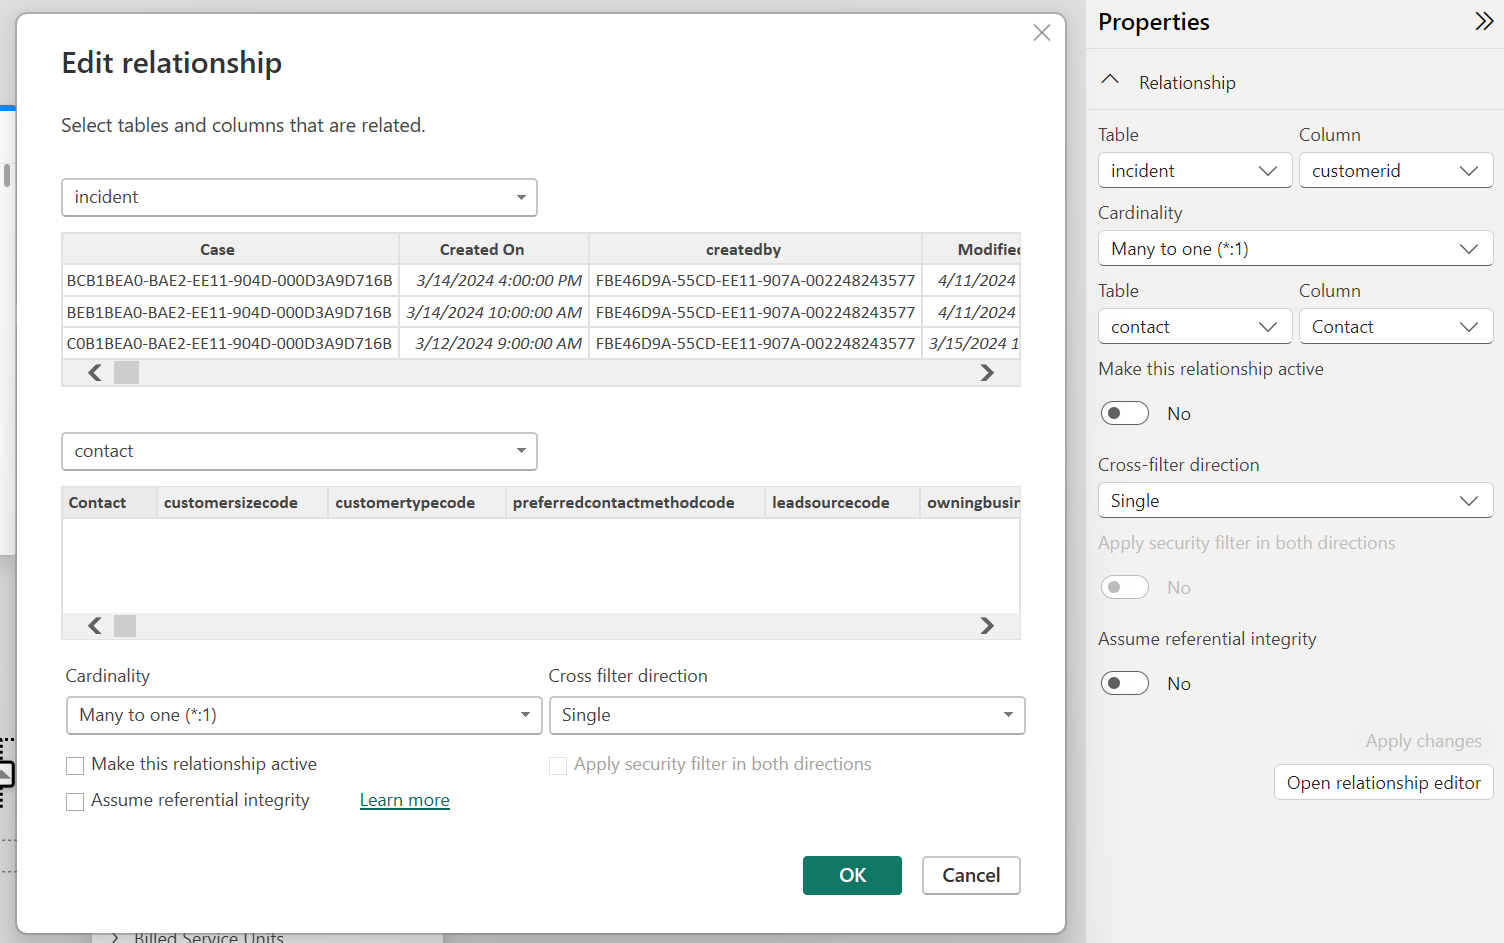
Let’s simplify the relationships for this example:
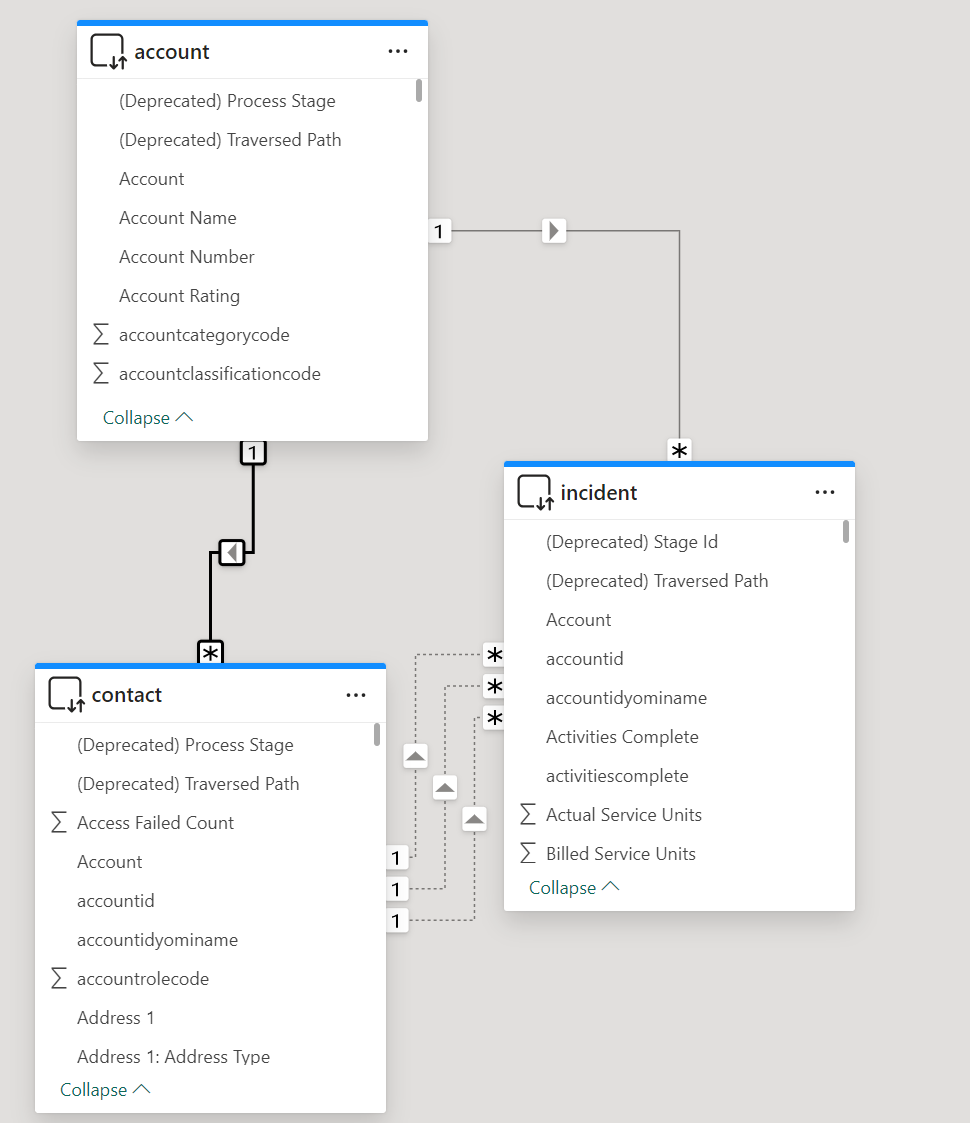
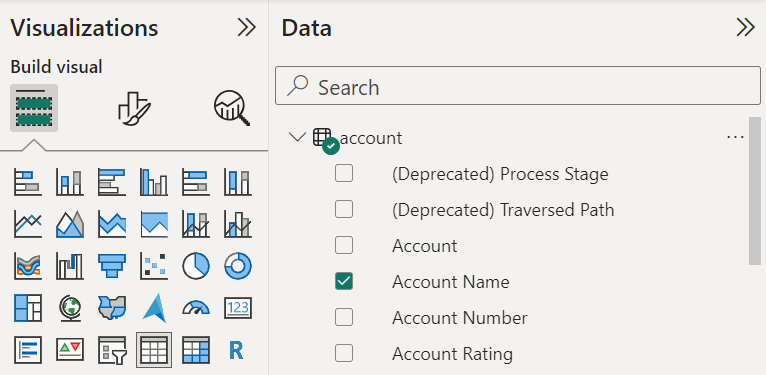
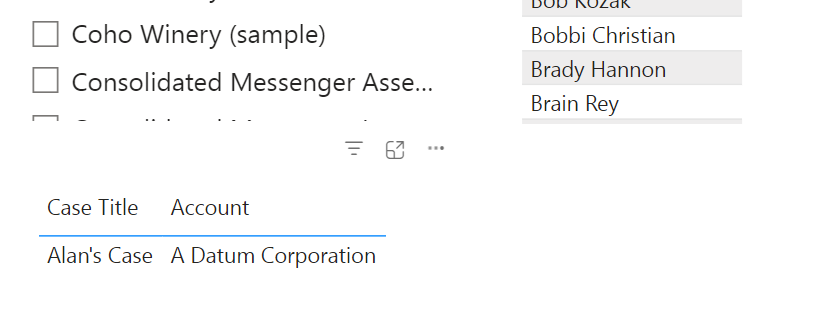
And go back to the Reports view and select these fields in a table visual:
- One filter with Accounts->Account Name
- One table with Contact->Full Name
- One table with Case->Case Title and Case->Account
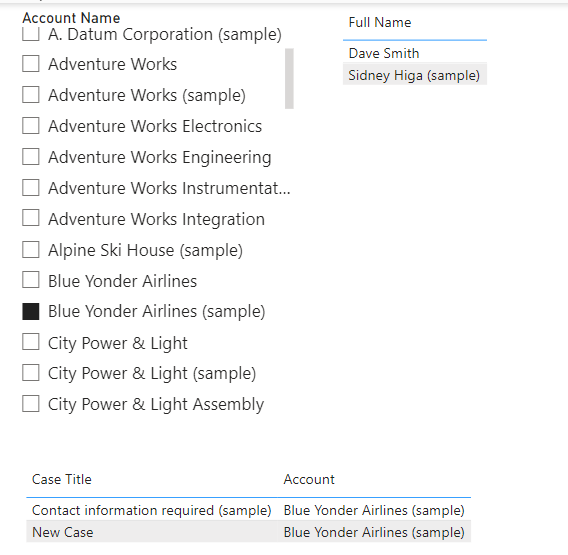
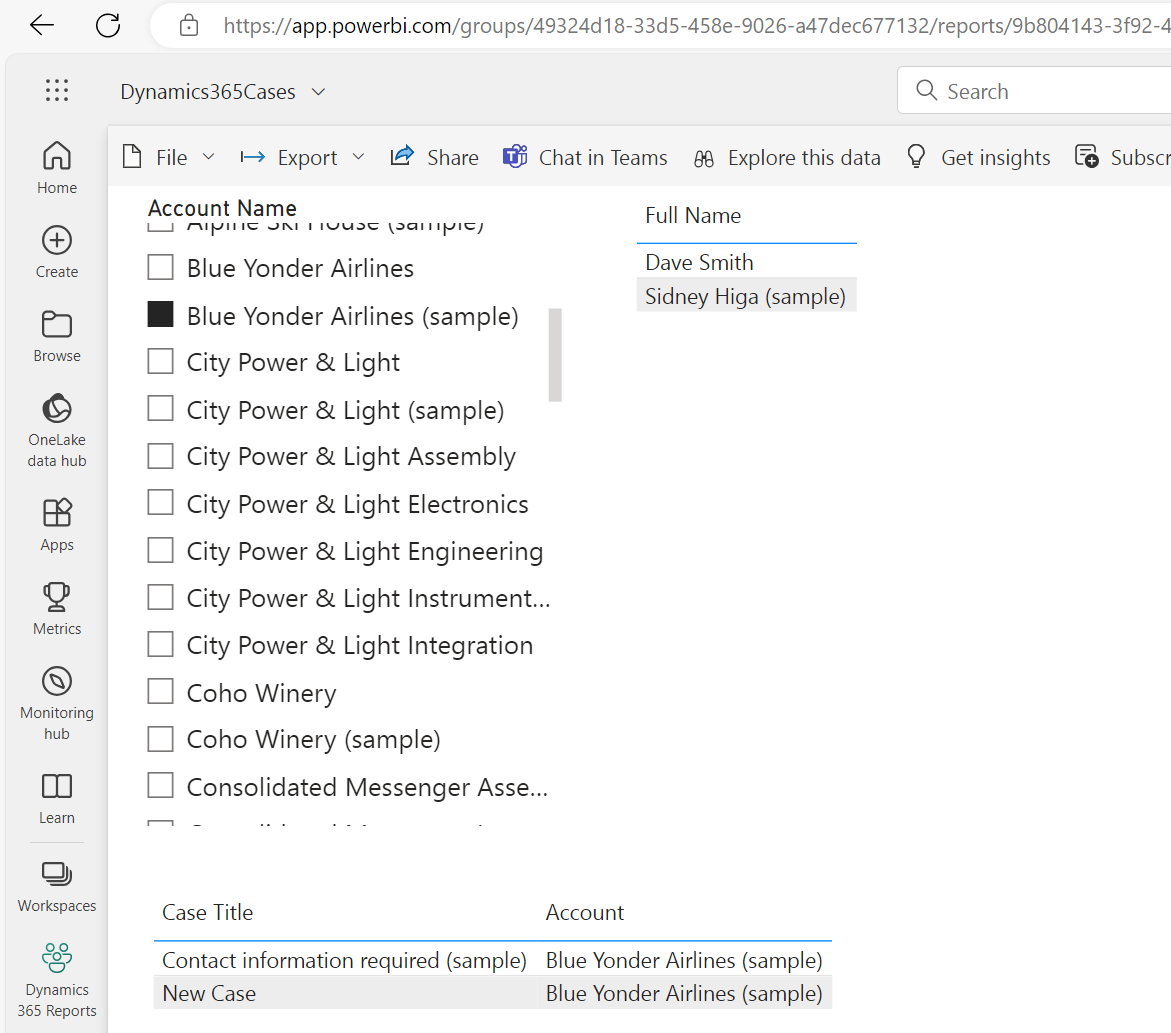
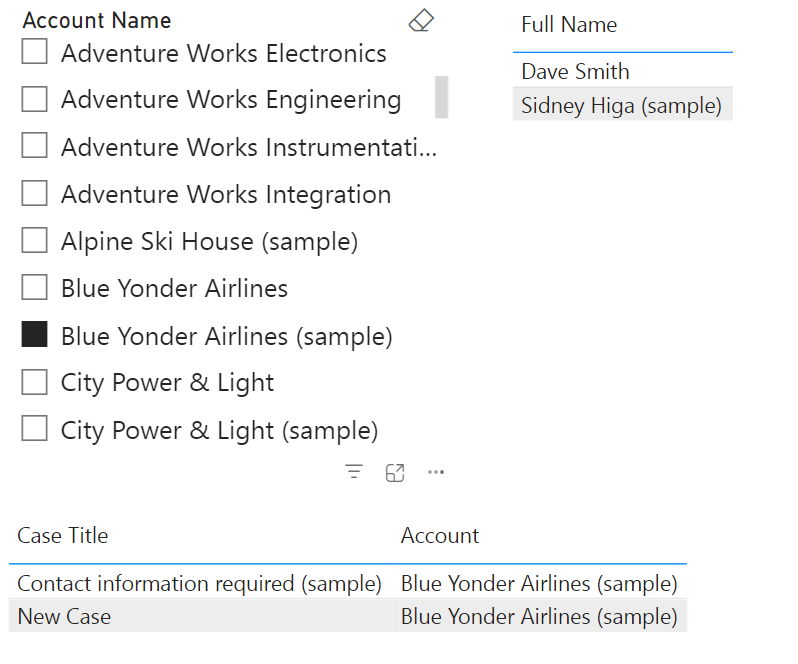
Our report looks like this, and we can see our relationships are working, if we select Blue Yonder Airlines (sample) it filters to the 2 contacts and 2 cases:
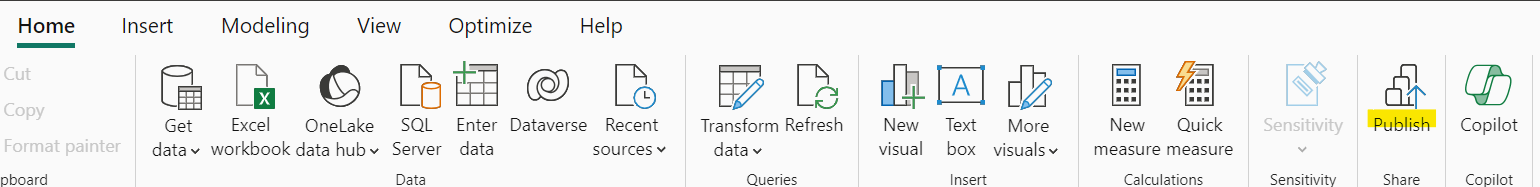
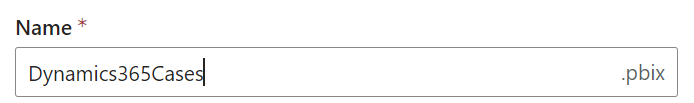
Now let’s save and publish this up to the Power BI service. When prompted, I saved the report as Dynamics365Cases.pbix:
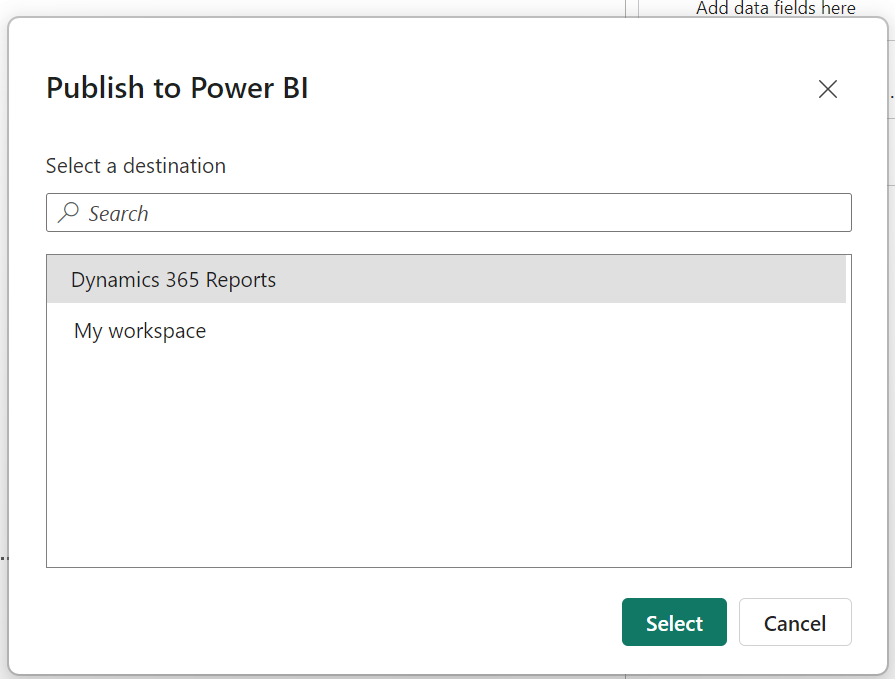
Select the Dynamics 365 Workspace we set up earlier:
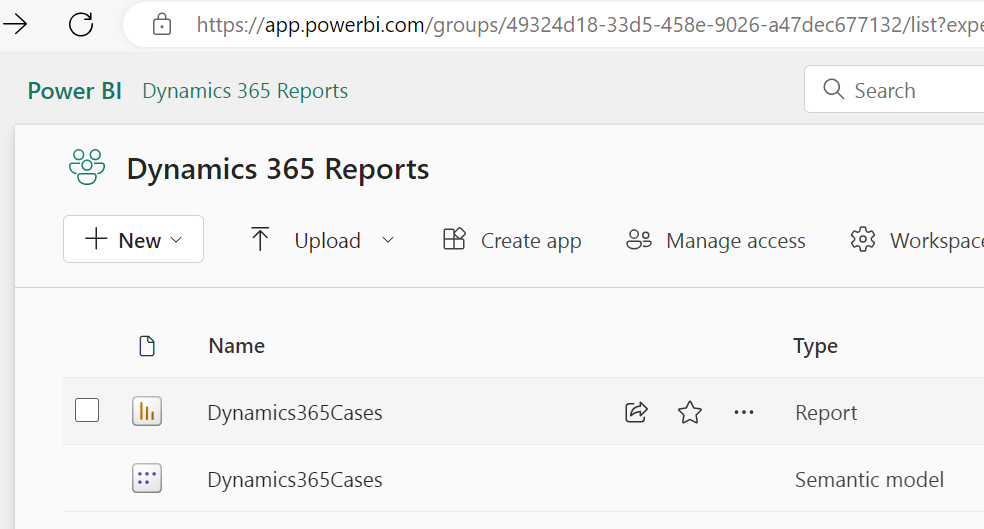
Once published, we can see the report in the Power BI service:
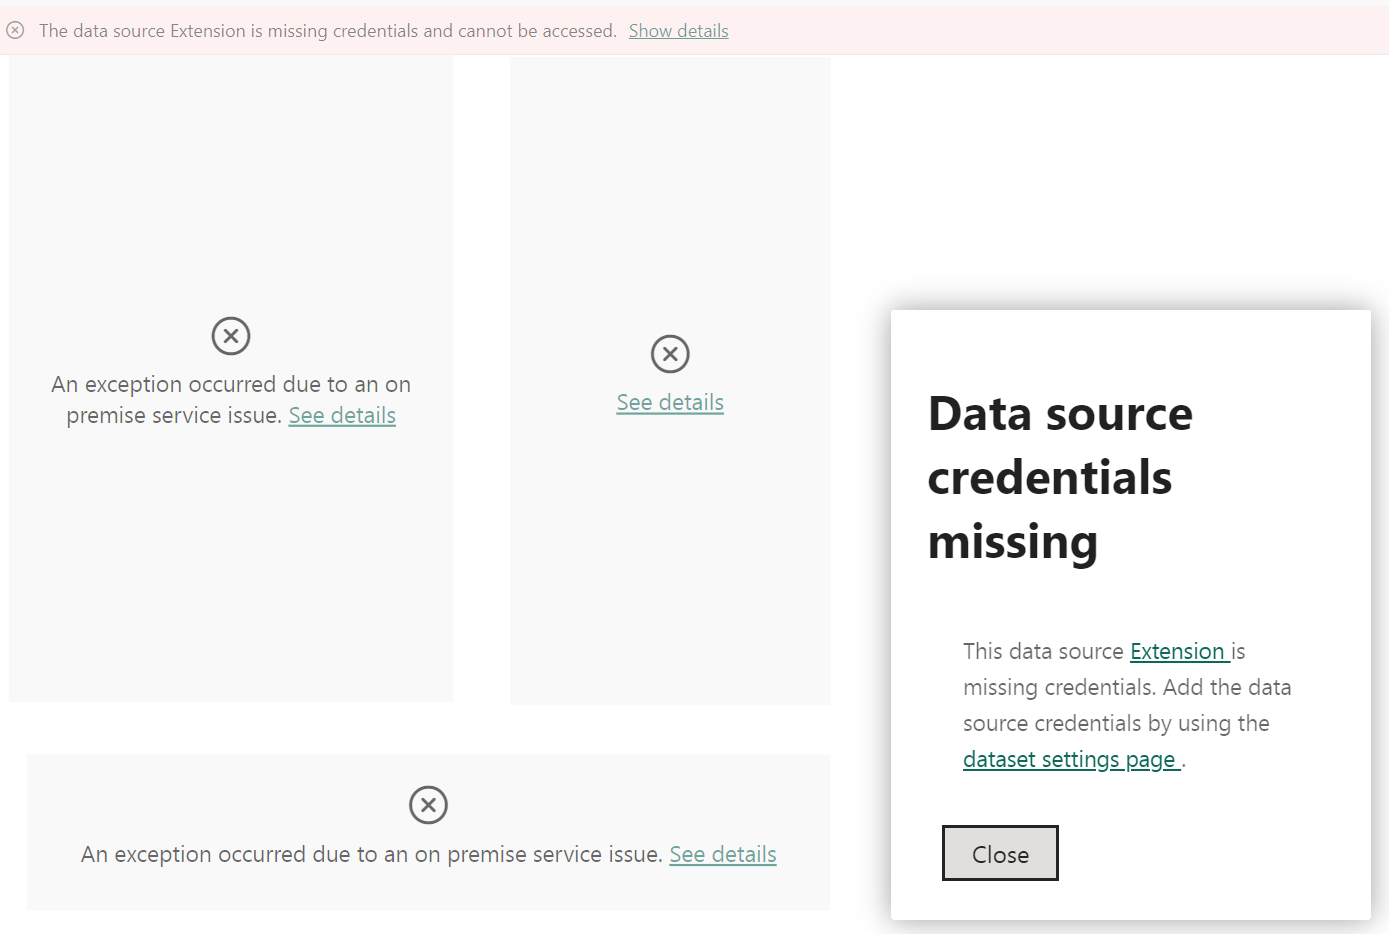
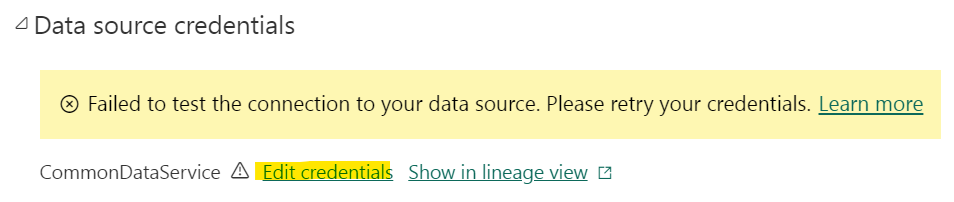
When we open the report, we see a data source credentials missing issue:
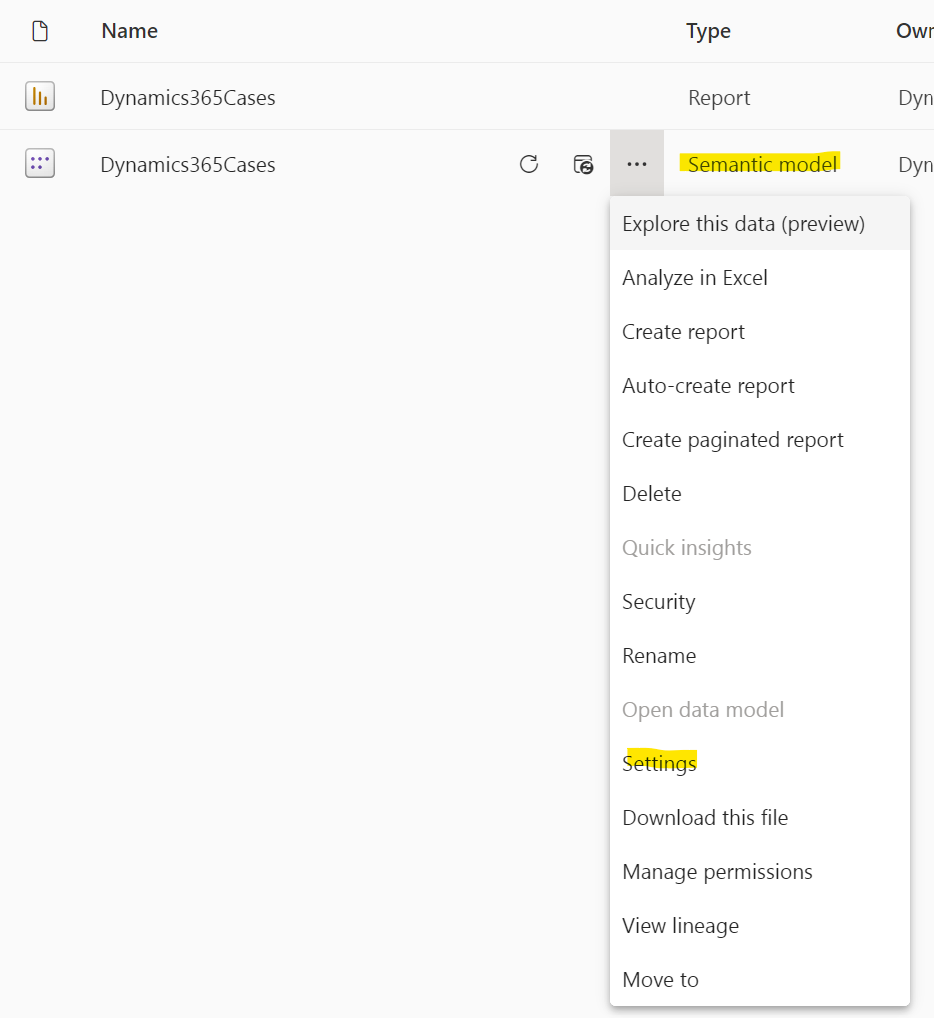
Go to Semantic Model->Settings:
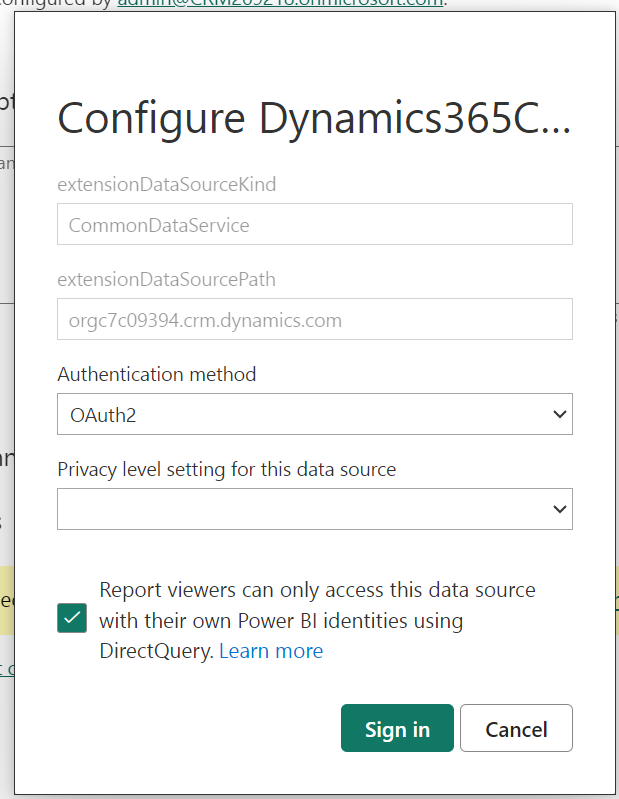
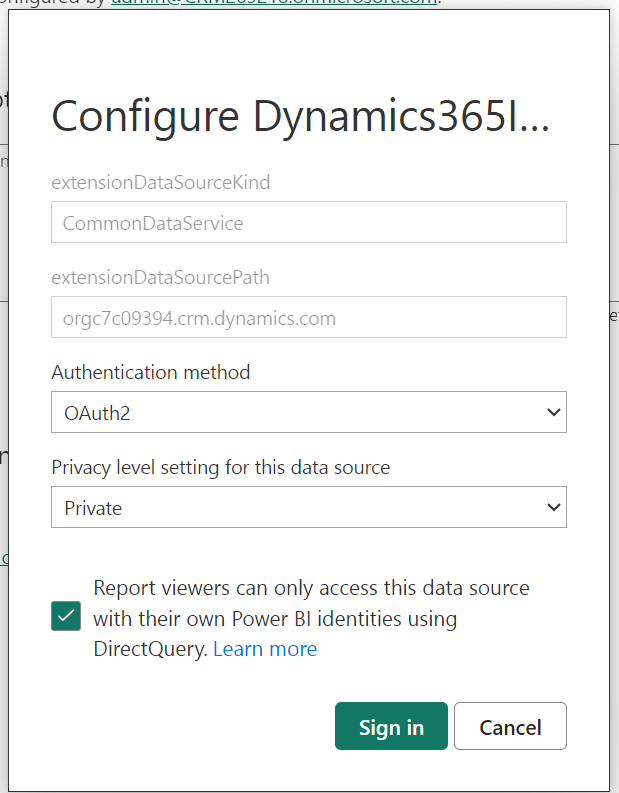
Under Data Source Credentials->Edit credentials:
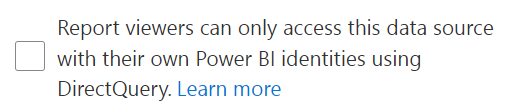
Sign in to the data source, checking “Report viewers can only access this data source with their own Power BI identities using DirectQuery”. We will talk more about the security here shortly:
We now see the data in our report:
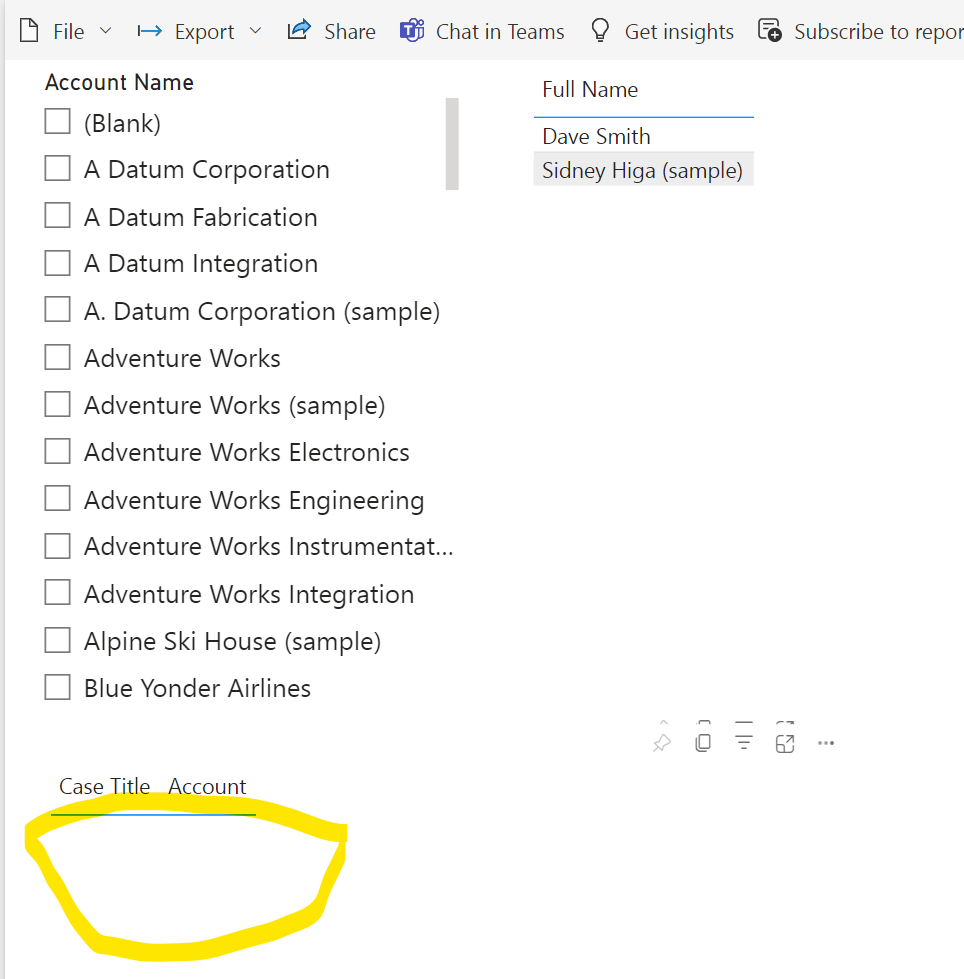
Let’s add another user to the report, Alan Steiner. His security roles mean he can only see cases in his business unit, which is different to the cases displayed above for Blue Yonder Airlines (sample). So when he views the report, he sees the following:
If he unchecks the Blue Yonder filter, he can see his cases:
Now, let’s go back to the Data Source Settings and unchecked the option to “Report viewers can only access this data source with their own Power BI identities using DirectQuery”:
Alan now sees all cases, even the ones outside his business unit. So his security is not applied here.
One note about using DirectQuery is the reports can take time to filter data (we will talk about optimizing this shortly). You may see this spinner sometimes that can take time to process:

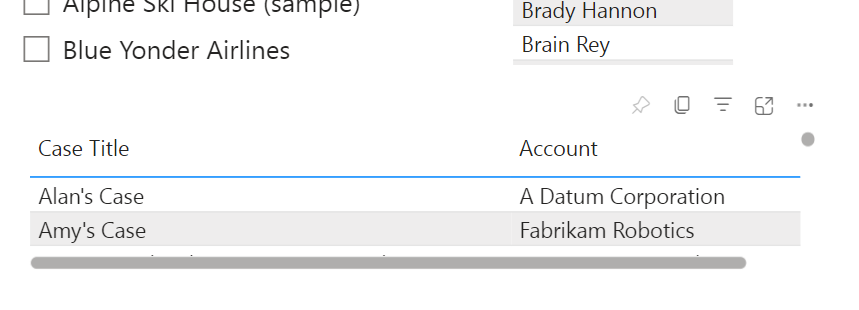
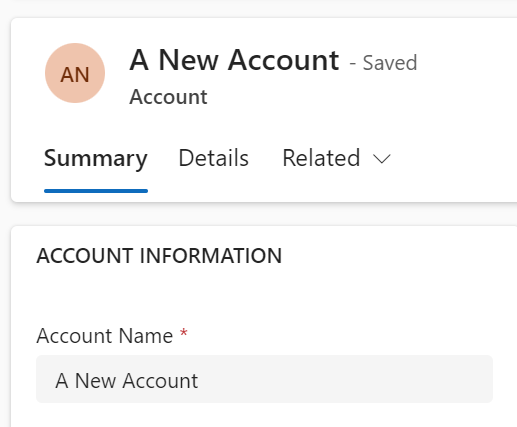
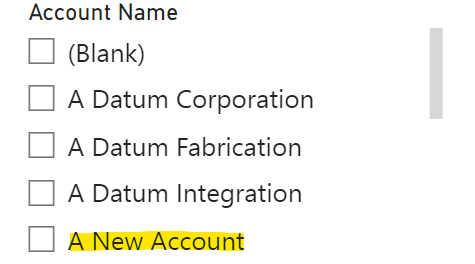
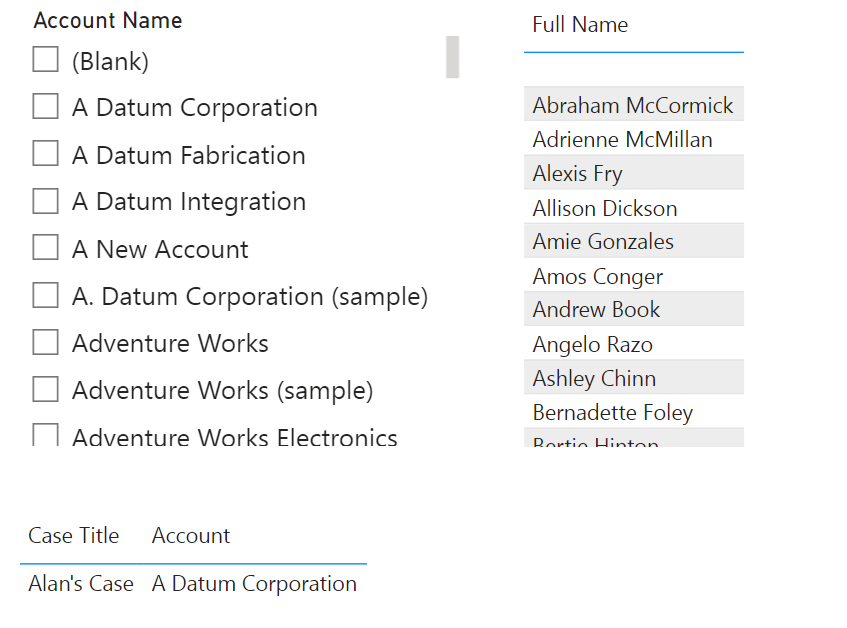
The advantage of DirectQuery is that the data is live. Let’s add a new account:
And now if I refresh the visual on the report:
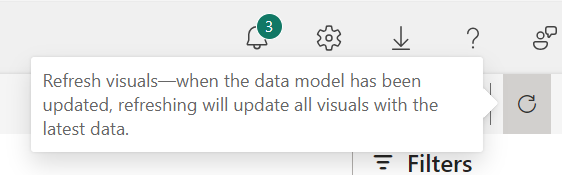
The new data is displayed:
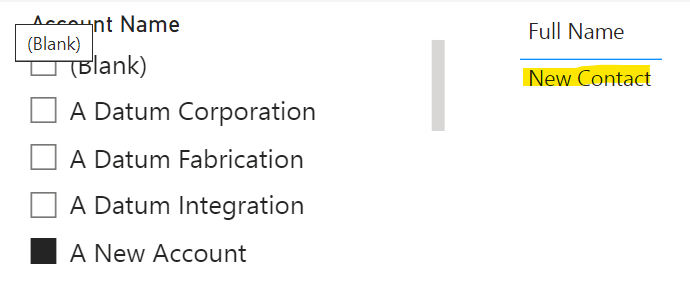
If we create a new contact under the “A New Account”, then select the “A New Account” filter without refreshing the report, we get the New Contact appearing as the data is pulled in near real-time.
Dataverse Import Report
Now, let’s create a similar report with the Import option. As above, create a new Power BI report and select the tables you want in the report, then click on Import:
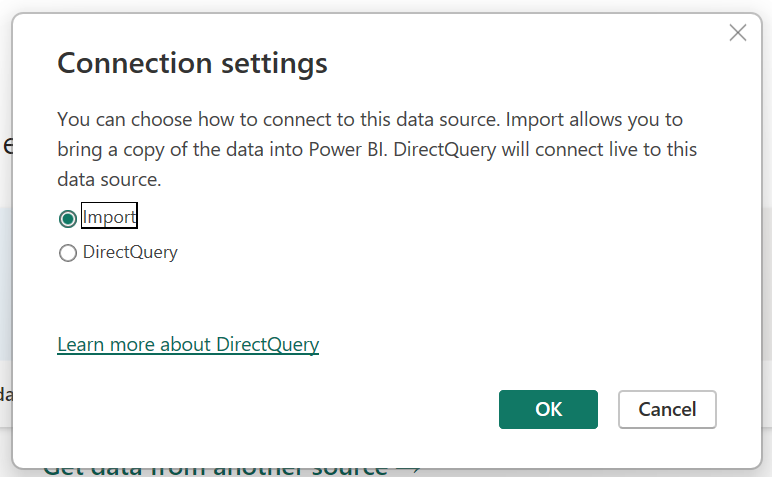
The difference between DirectQuery and Import is with import the data is imported into the Power BI cache. It can take time to import the data into the Power BI cache, but once it’s in there adding it to a report should be quick. Report performance can depend on many factors such as relationships, transformations, data sources, etc, and the simpler reports should perform well. In this current test, import took a few minutes and building the report was fast. With DirectQuery, the performance of waiting for each visualization to load was slow without optimizing the query, but once the report was optimized by removing unnecessary columns the performance was much better. However, this isn’t a rule exactly, as mentioned there’s many factors involved.
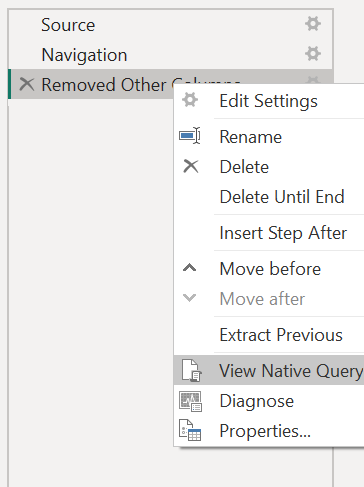
To improve performance, in the Power Query editor, Choose Columns and only select what you need:
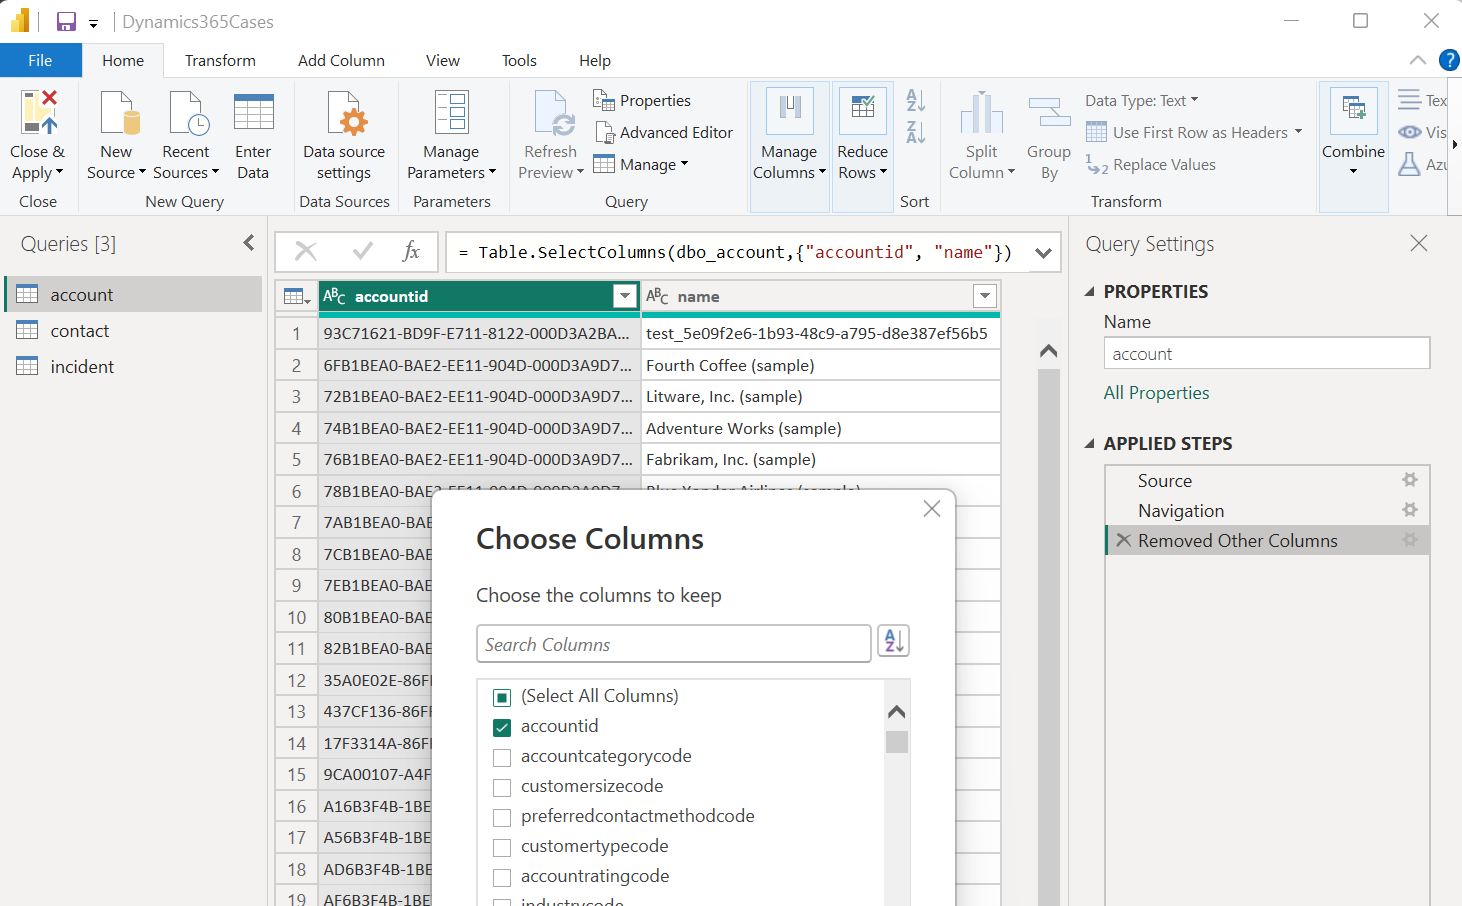
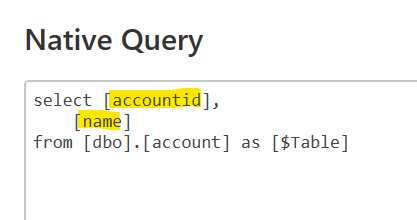
You will then see Power BI query folding come into play, which optimizes the data load:
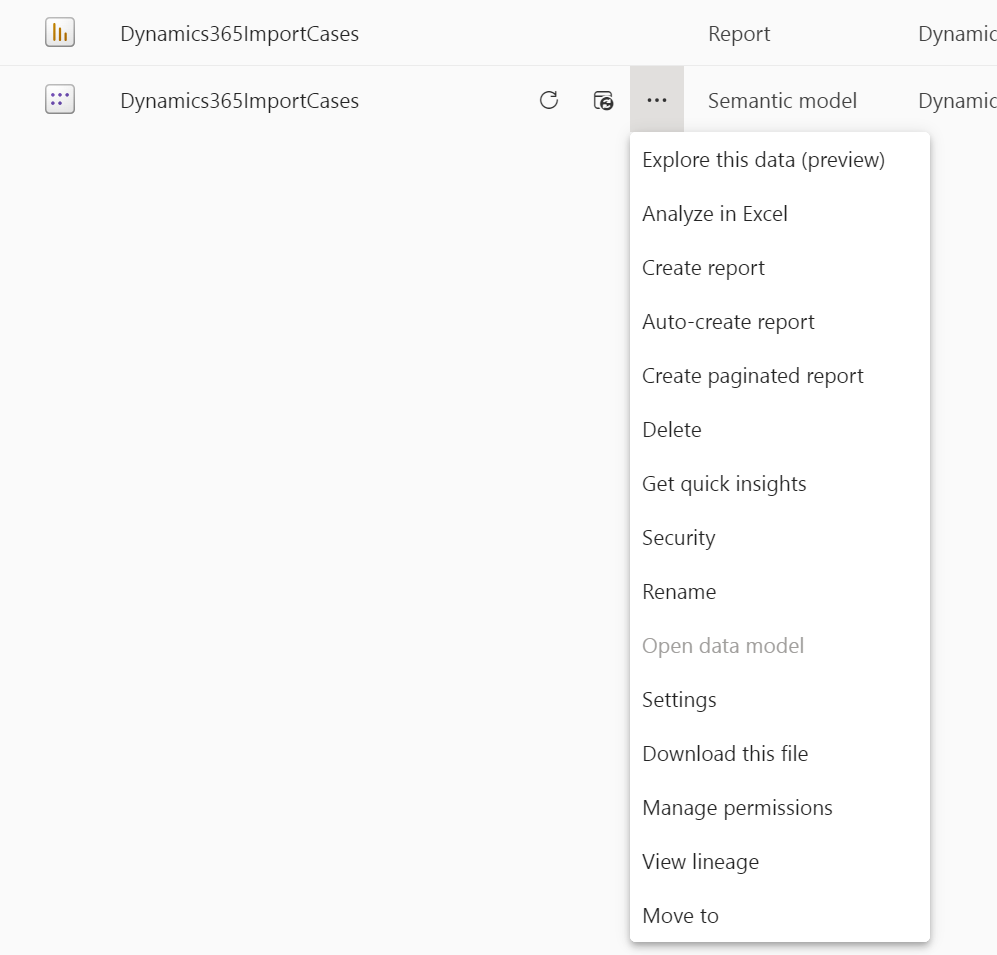
Let’s upload the report then will we look at more differences. We will call the report Dynamics365ImportCases.pbix and publish it to the same workspace above. Now let’s go to the Settings of the report:
Confirm a user is applied:
Once on the report, the filters react quickly when selected, without the spinner:
Now at this point, Alan Steiner who has limited business unit security sees all the records, even though the option above to use Power BI identities is checked, as that setting applies to DirectQuery:

Now, let’s look at what happens if we set the user assigned to the Data Source as Alan Steiner and refresh the report manually (we will talk about refresh next):

In this case, all users will be limited to what Alan can see as he owns the dataset, so in this case we only see Alan’s reports whether we are an admin or Alan:
In order to implement security we can use row-level security, which I blogged about some time back. As a refresher, you can implement security within Power BI, but you can’t copy the Dynamics 365 security model. So if you need user security (some reports like showing aggregated data do not) then you may want to use DirectQuery and see how the performance is.
Azure Synapse Link
Azure Synapse Link is a way to get Dataverse data into an Azure Data Lake, which can then be used to report using Power BI. The data lake is a copy of the live Dataverse data. Setting up the integration is easy to do through the Power Apps Maker Portal. We won’t go into details on how to set up and use this in this blog, but it is an option for Power BI Dataverse reporting and analytics if it’s an option for your organization.
Using Power BI Reports in Dynamics 365
Let’s move forward and see how these reports look in Dynamics 365, and our embedding options. As they’re in the Power BI service, they are ready to use.
In the Power Platform Admin Center, there are a few places to enable Power BI content. The first is “Power BI Visualization embedding”, which enables us to embed Power BI into dashboards:

The next is Power BI components settings, which is in Preview. This is about allowing the creation and usage of Power BI components, assigning permissions to Power BI workspaces, and allowing information sharing between Power BI workspaces in other geographic regions:
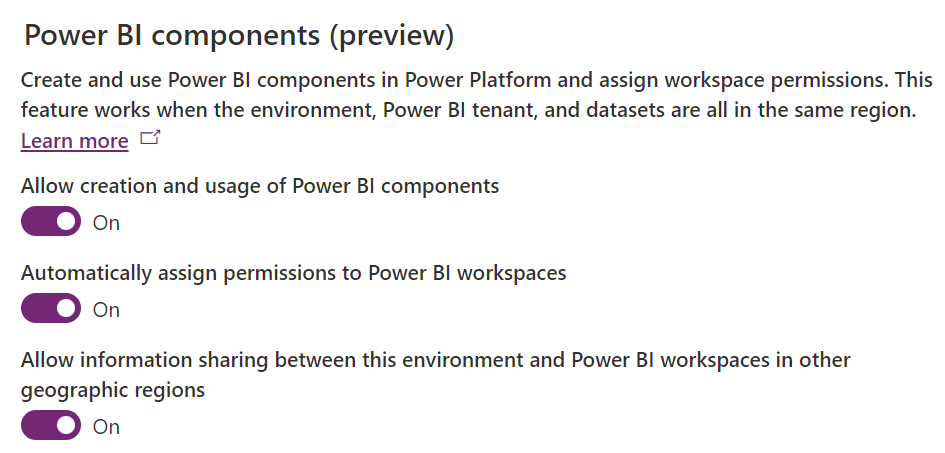
Save these settings if you have enabled them.
Let’s start with embedding Power BI on a Dynamics 365 dashboard. We have 2 options:
- Create a whole dashboard of Power BI
- Embed some components of Power BI in a standard Dynamics 365 dashboard
If we create a new Power BI Dashboard in Dynamics 365, we need to first create a Power BI dashboard in the Power BI service. Note the distinction, there’s:
- A Dynamics 365 standard “dashboard”
- A “Power BI service dashboard” created in the Power BI service
- A Dynamics 365 Power BI dashboard created in Power BI
All 3 are different!
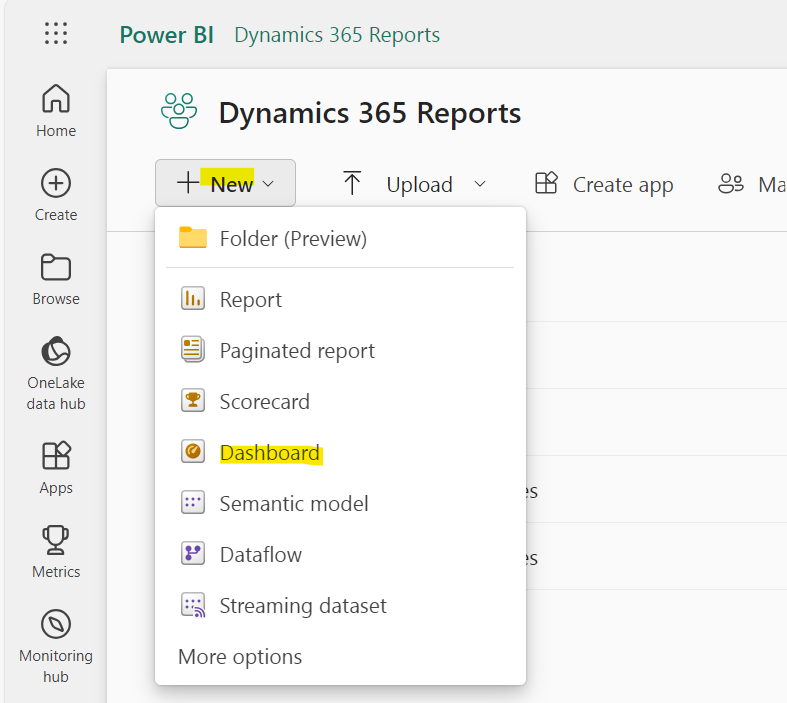
Go to the workspace and select New->Dashboard:
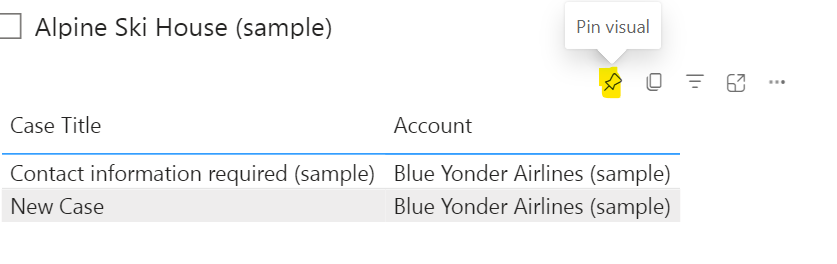
We can pin our visualizations onto new or existing Power BI dashboards. Let’s pin our cases list visual from the DirectQuery report:
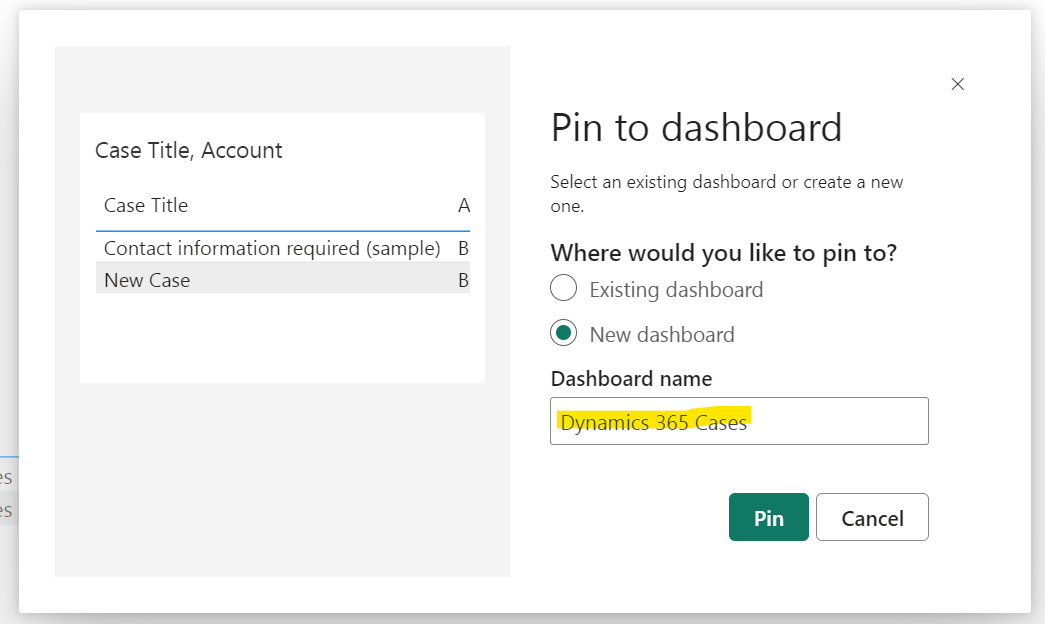
I will pin this to a new dashboard called Dynamics 365 cases:
And also pin the pie chart on case count:
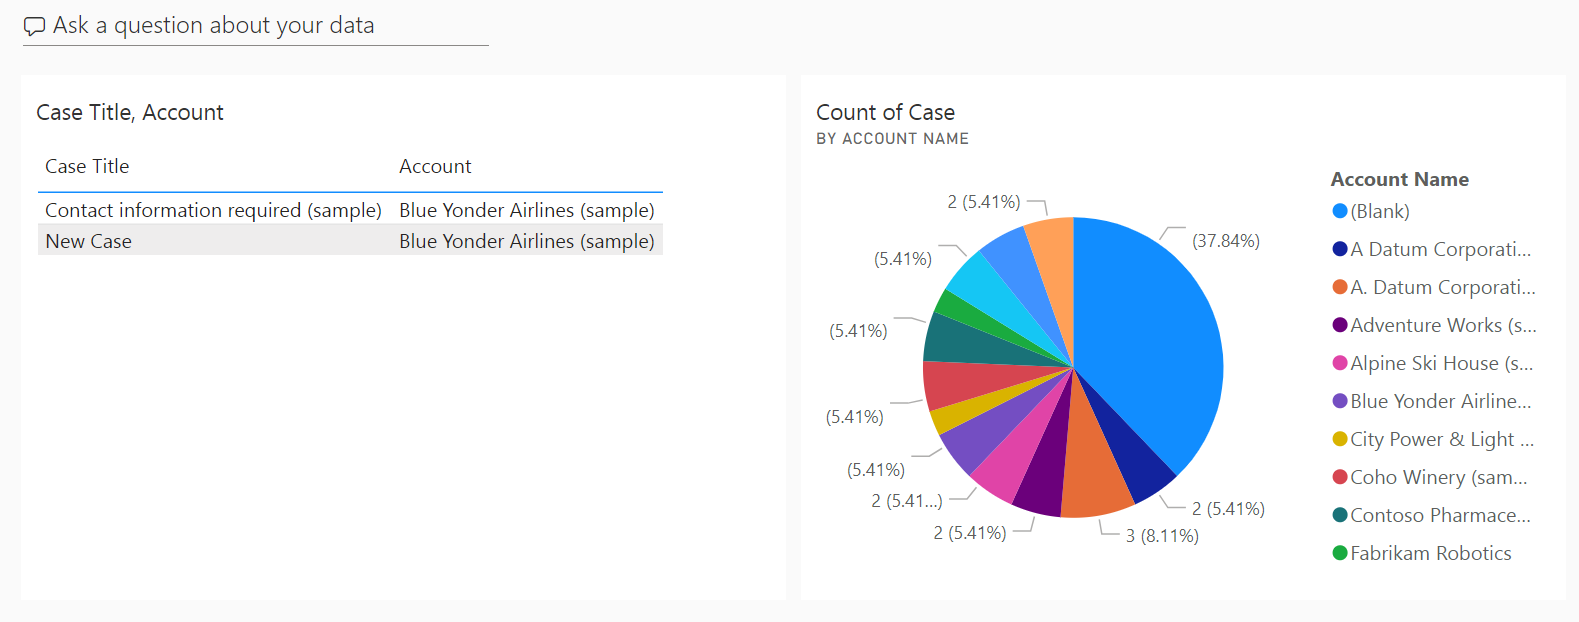
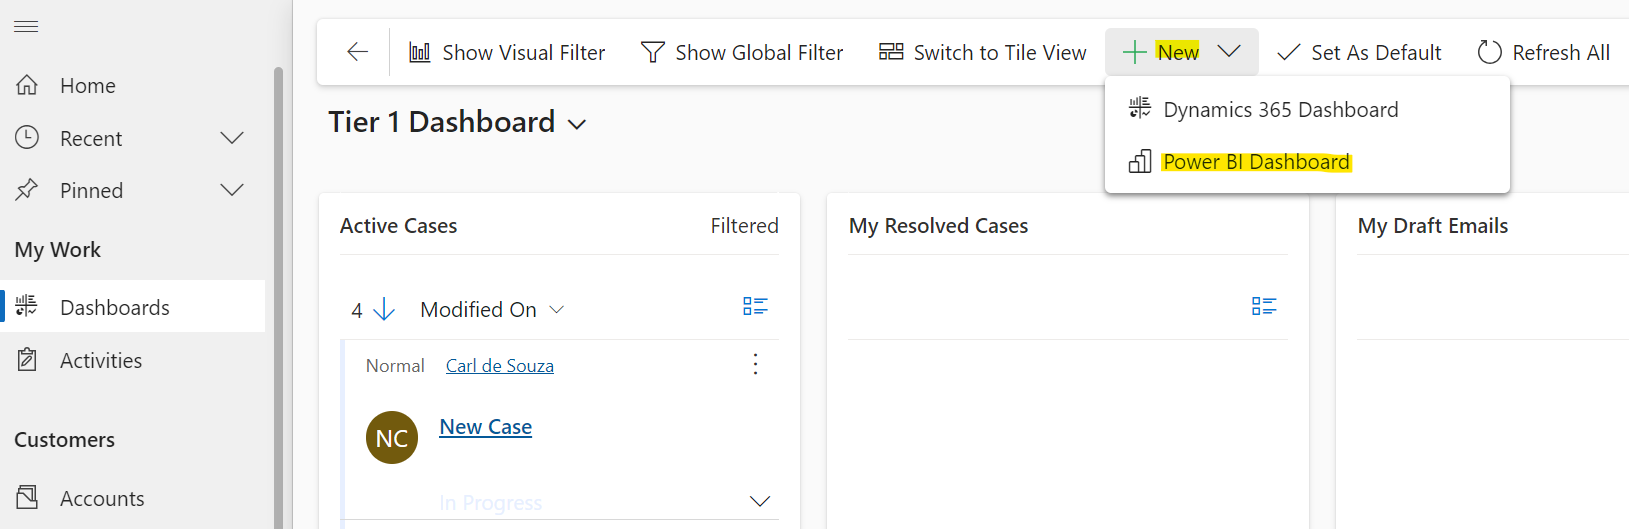
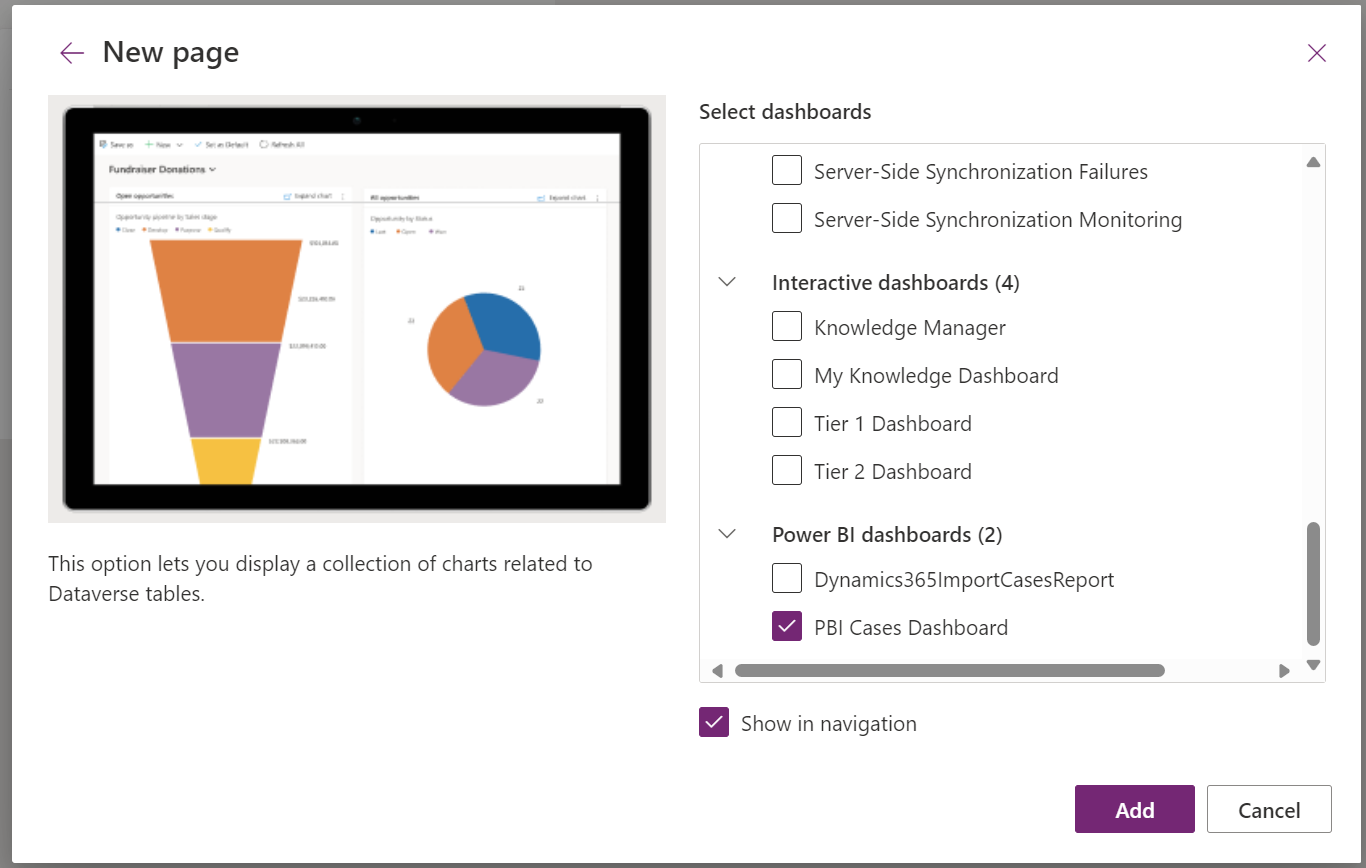
What’s cool here is a dashboard can be made up of data from different reports, and therefore different data sources. Now let’s use this in Dynamics 365. Let’s create a new Power BI dashboard inside Dynamics:
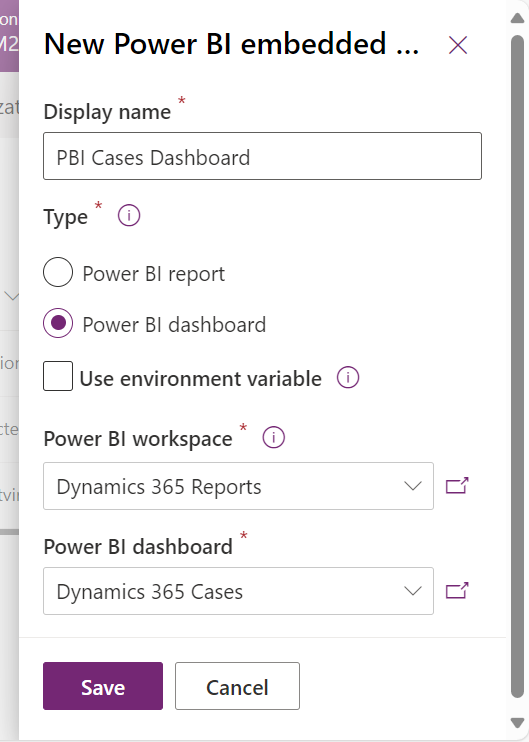
We’re prompted to select the Power BI workspace and dashboard:
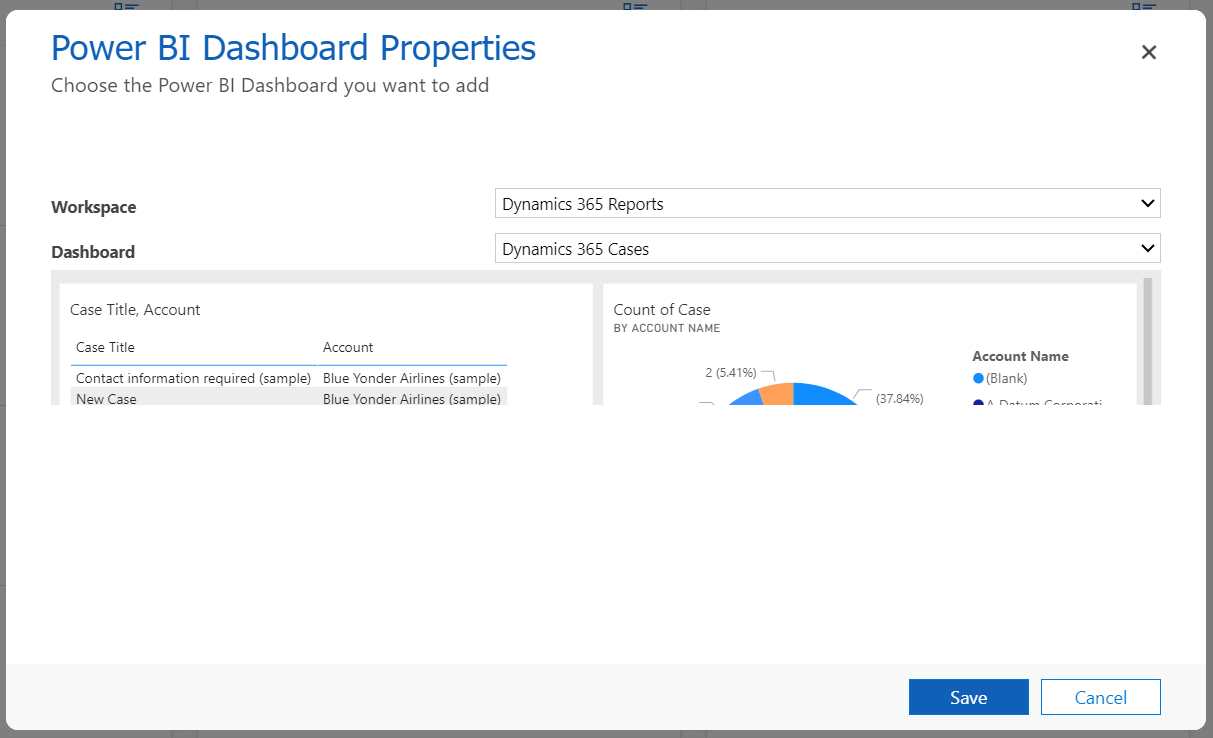
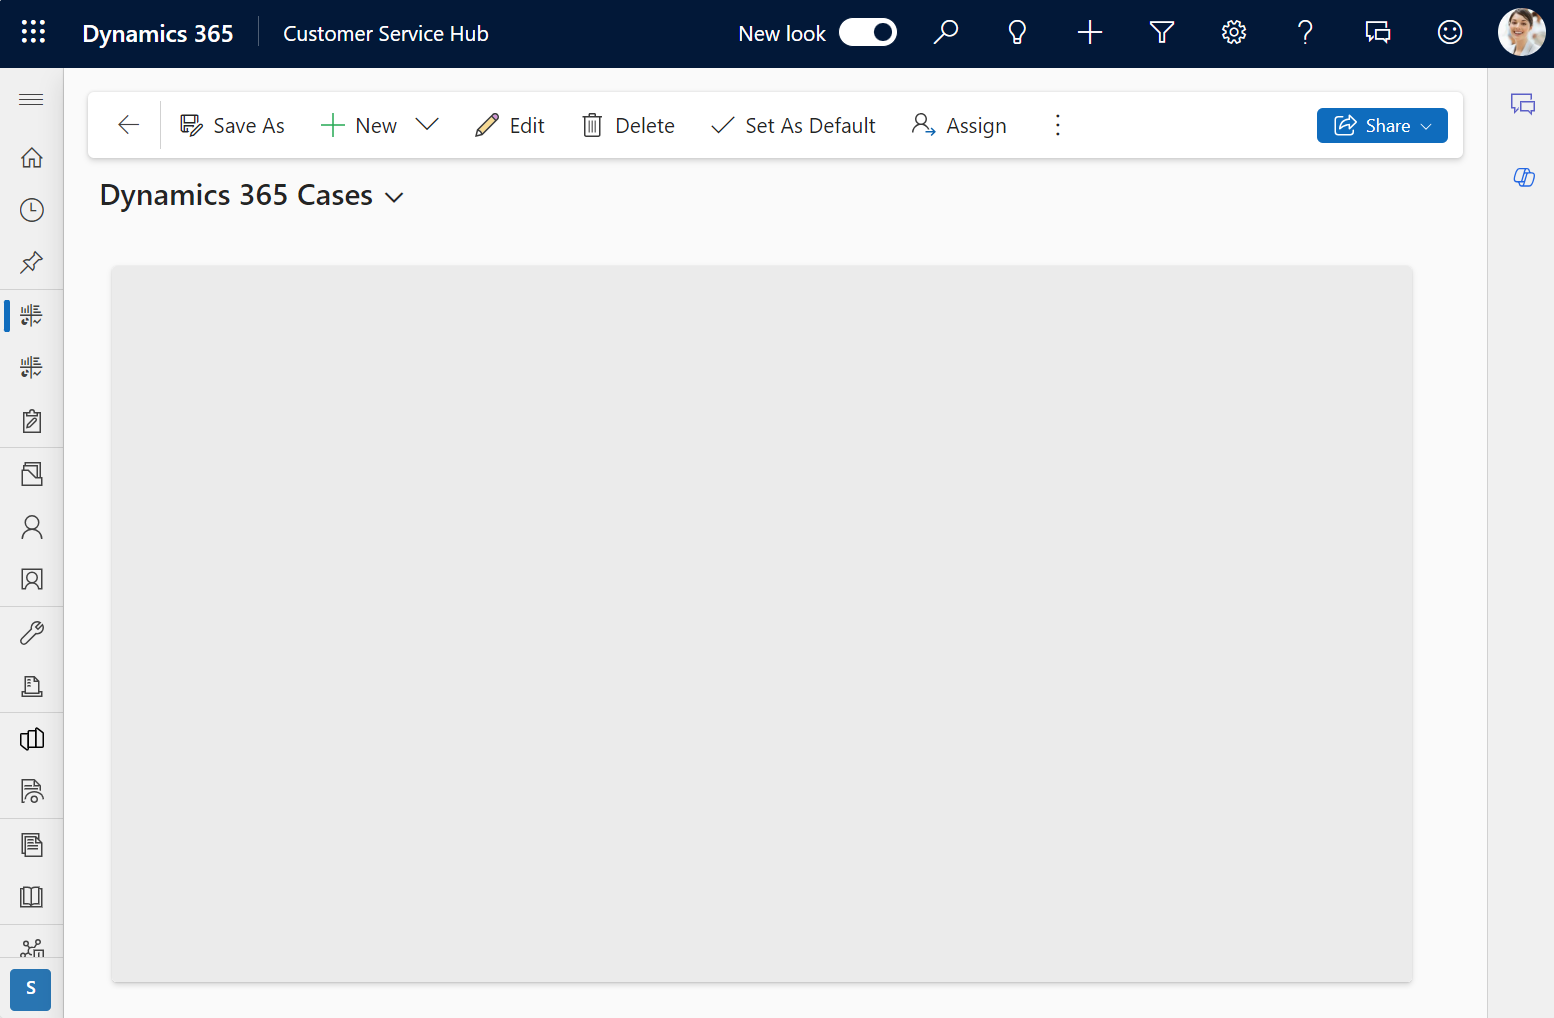
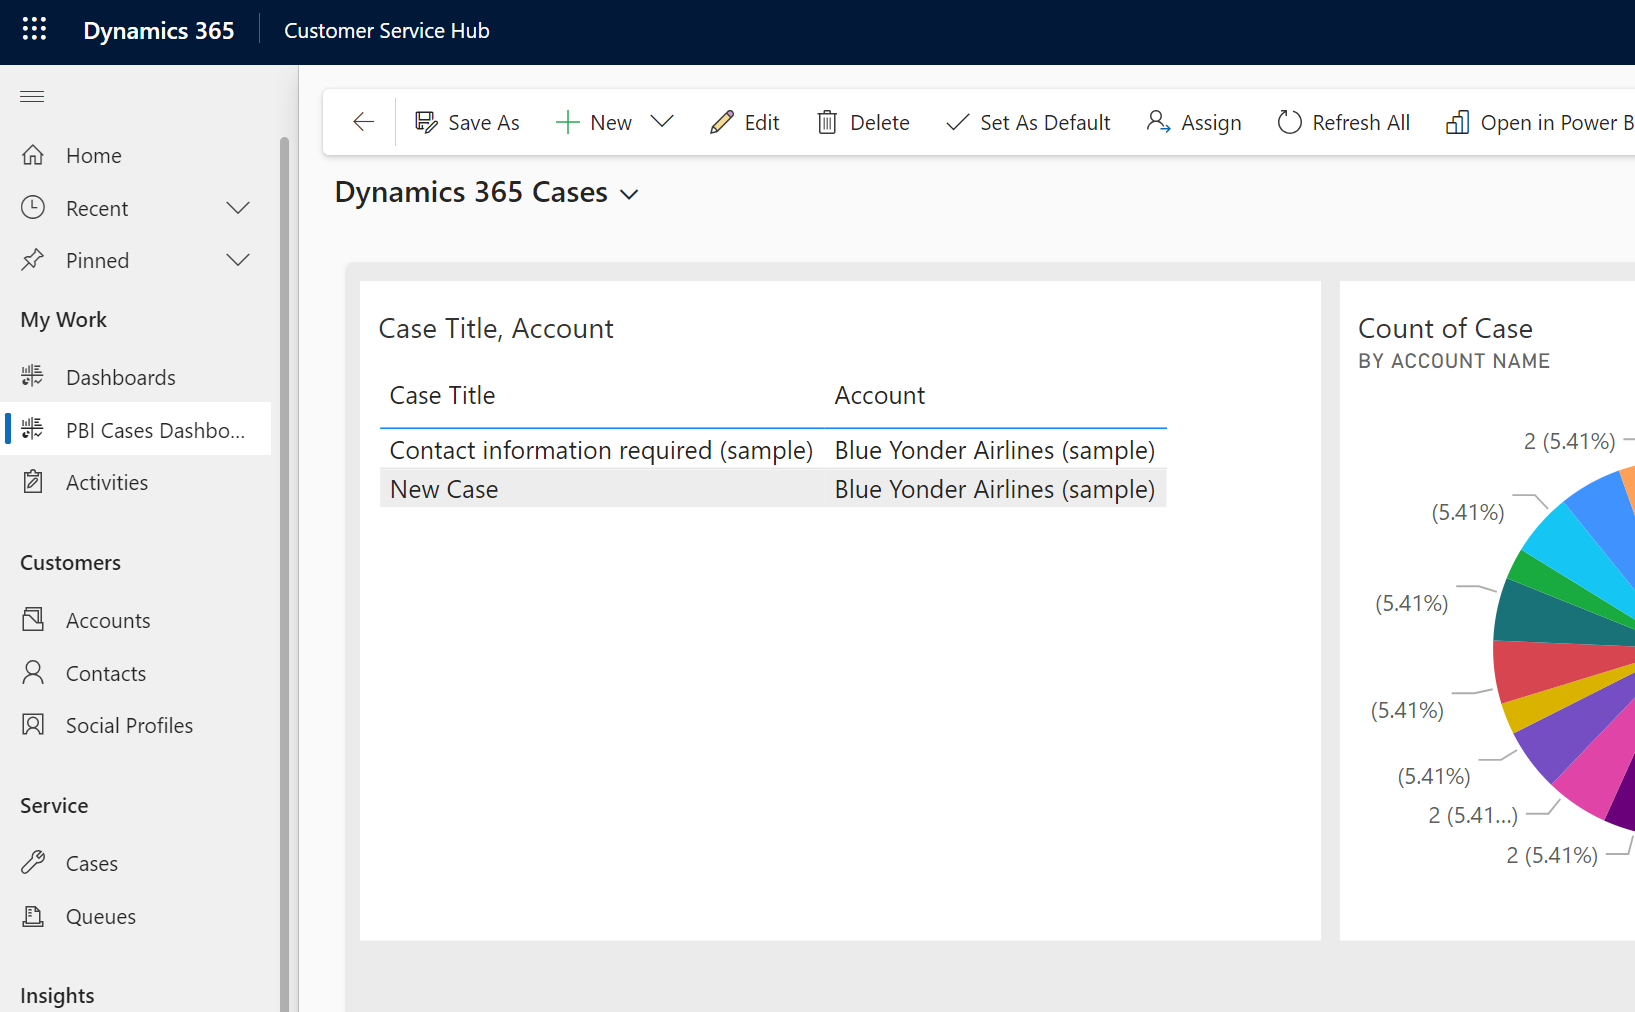
Click OK and we see the dashboard in Dynamics 365:
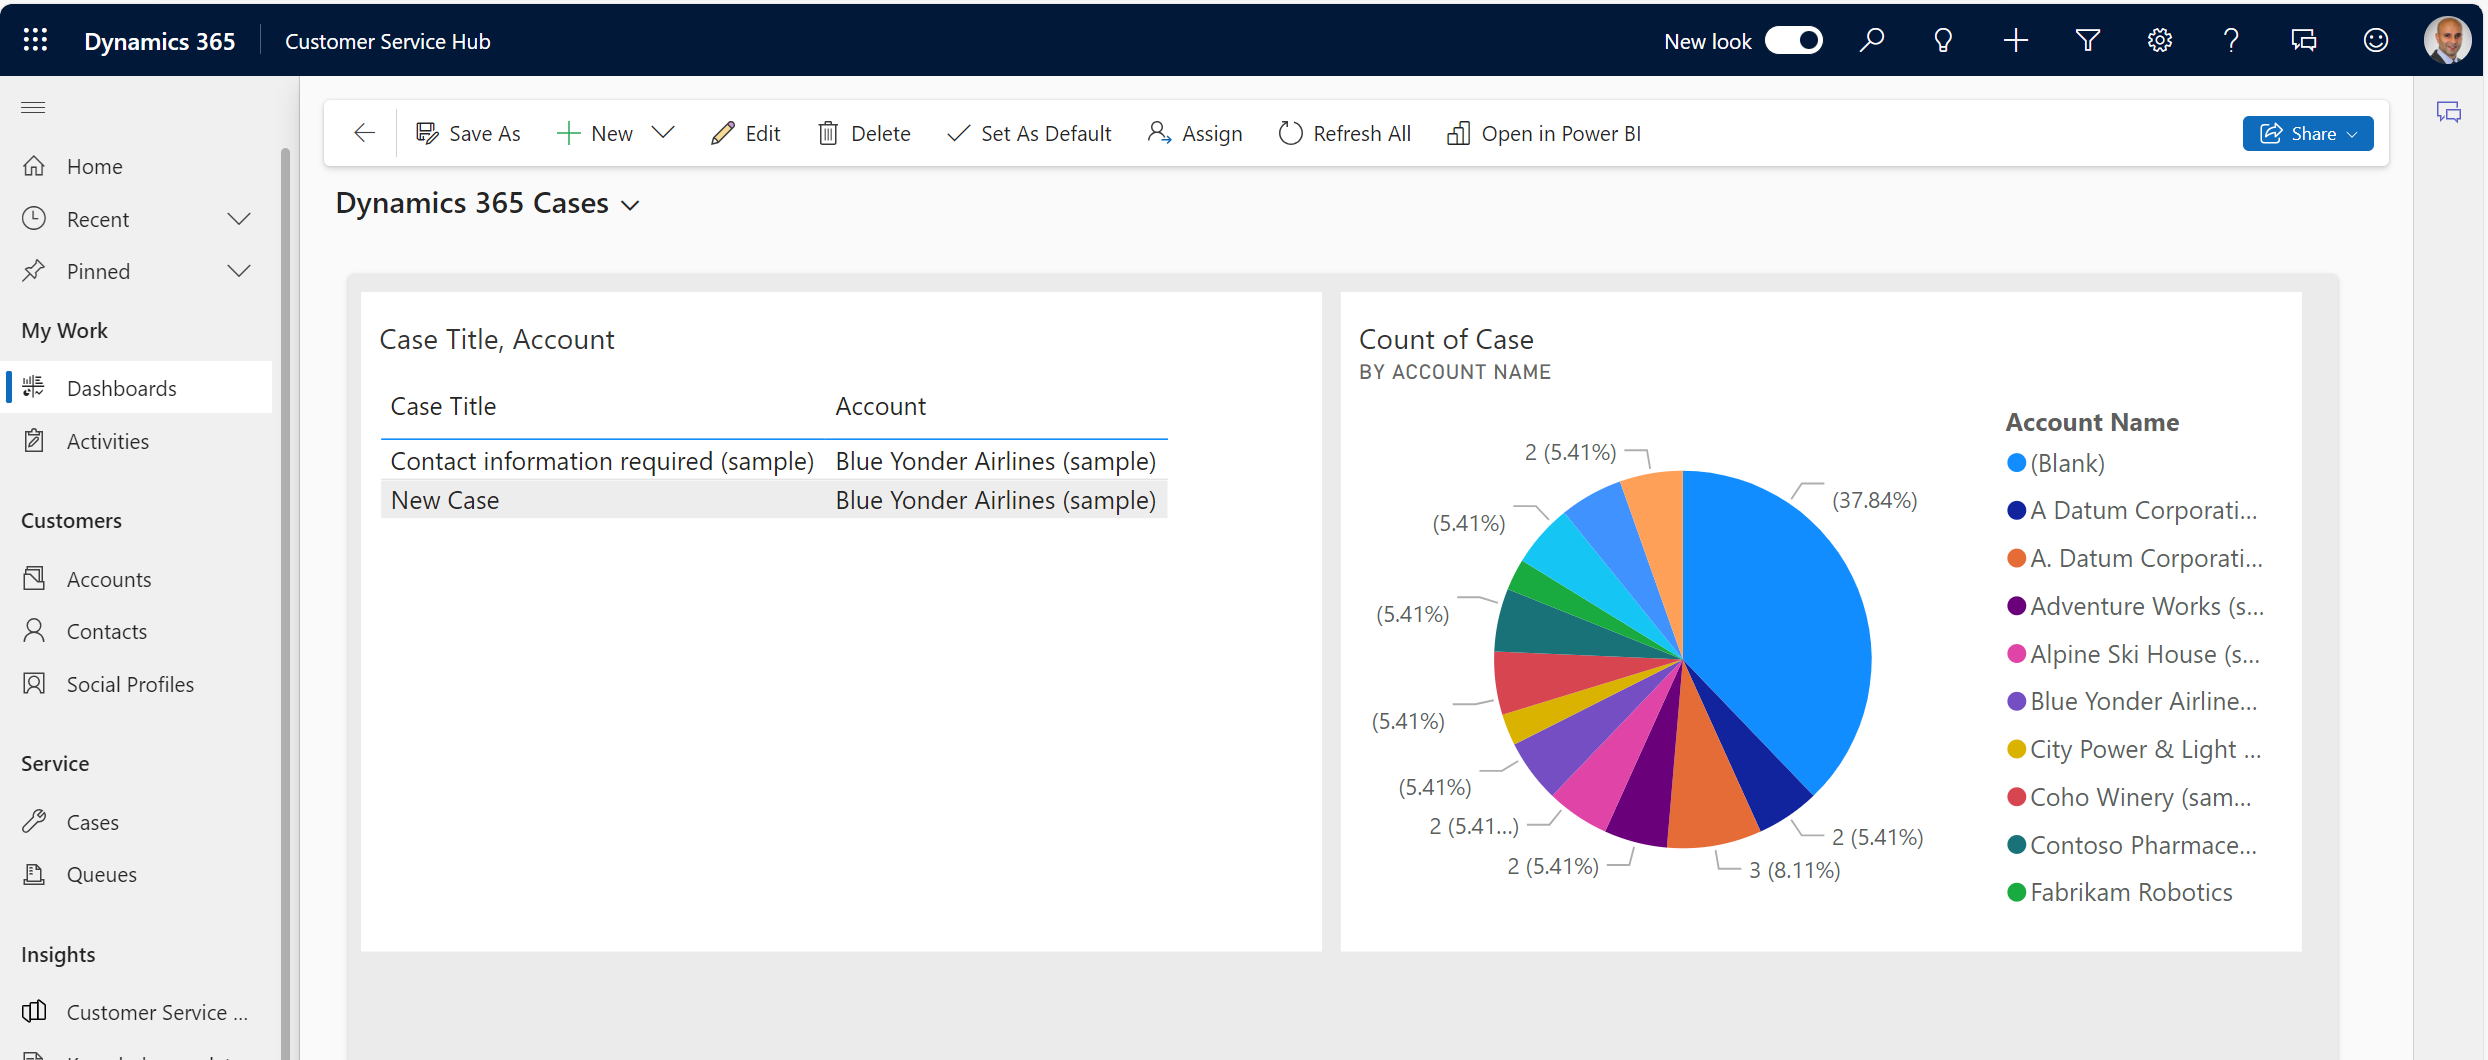
From here, a user can click on any visual and it will open the Power BI report embedded in a modal window:
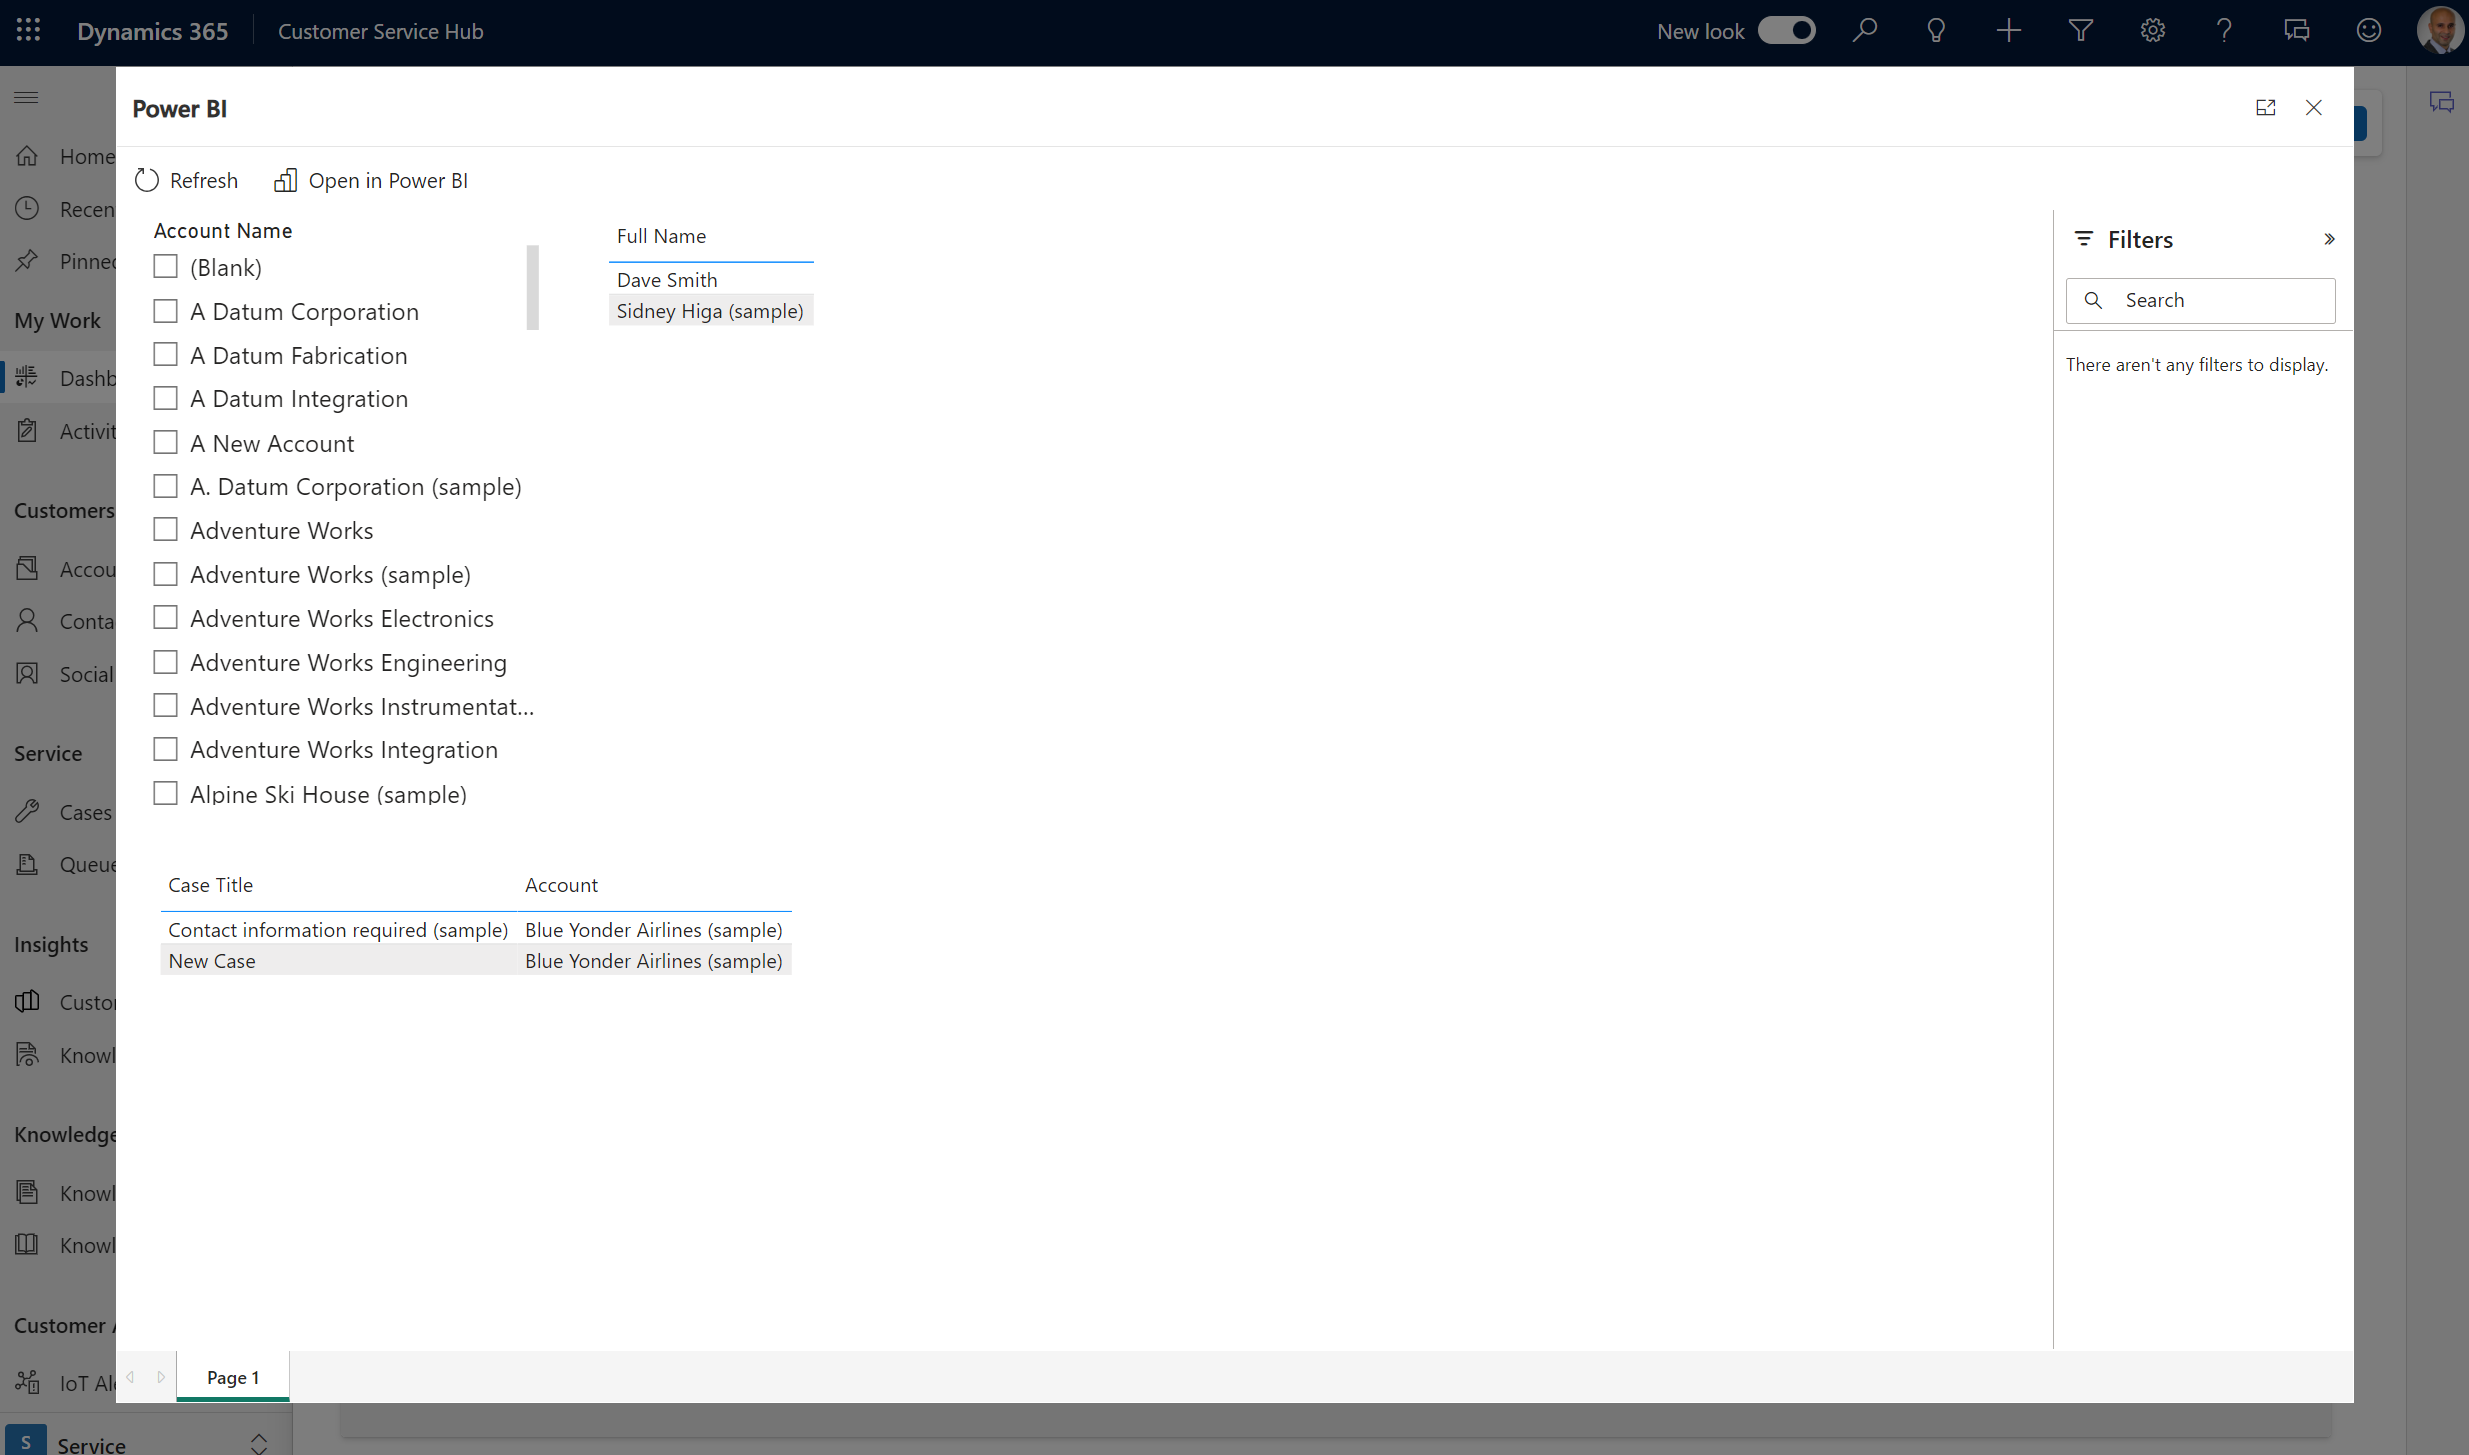
And from here they can go back to the Power BI service if they want to through the “Open in Power BI” link.
These dashboards aren’t available to other users if created this way unless you go through the Share button and give another user access:
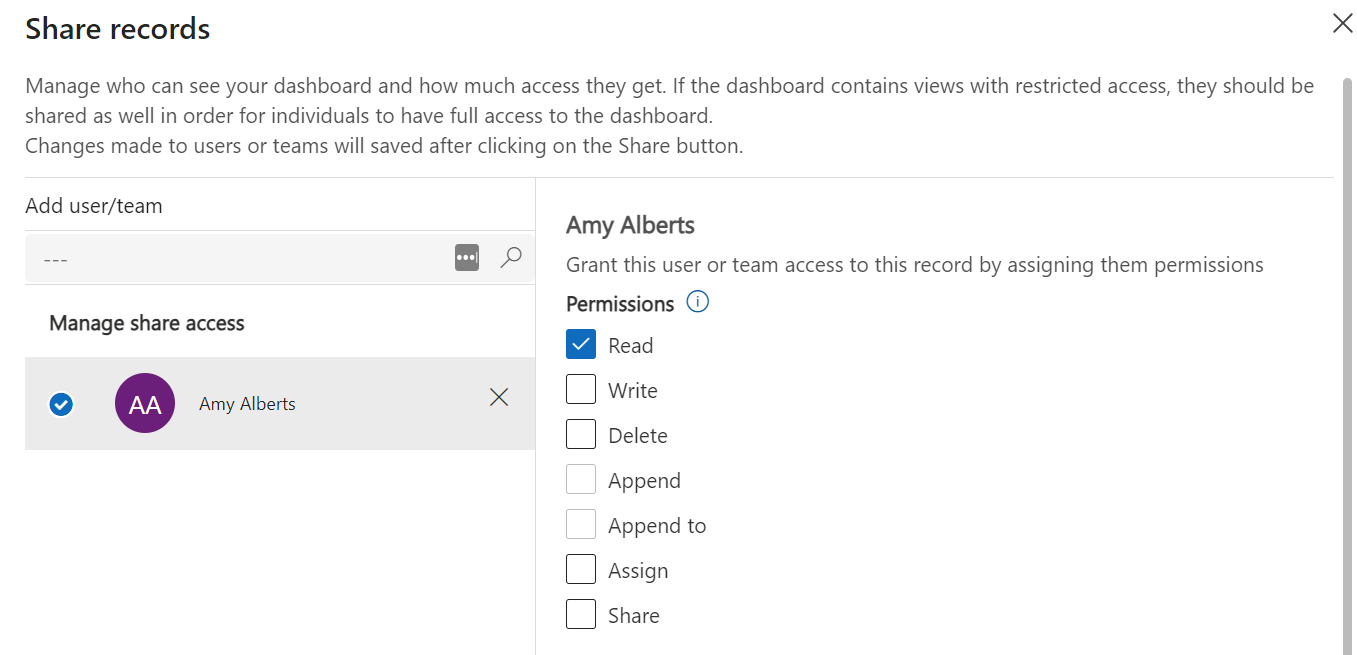
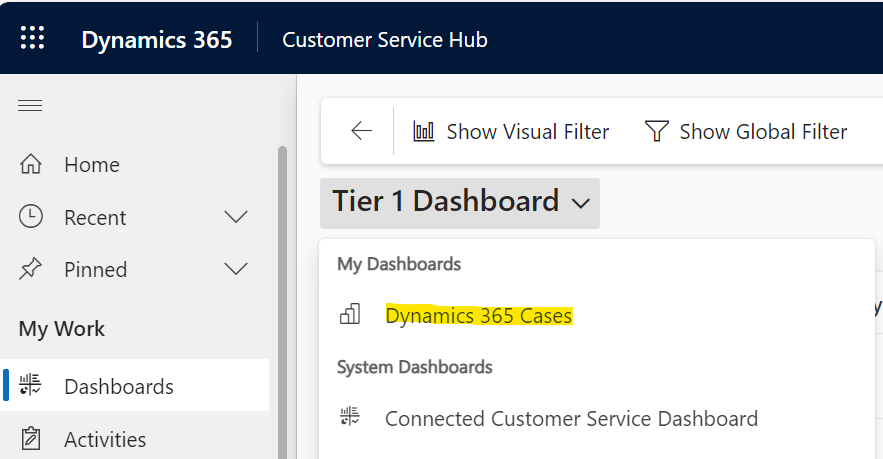
This user then sees the dashboard in their list of “My Dashboards”:
But they will need access to the Power BI workspace to be able to see the report data or else they get the message “It looks like you don’t have access to this report. Ask the report owner to share it with you”:
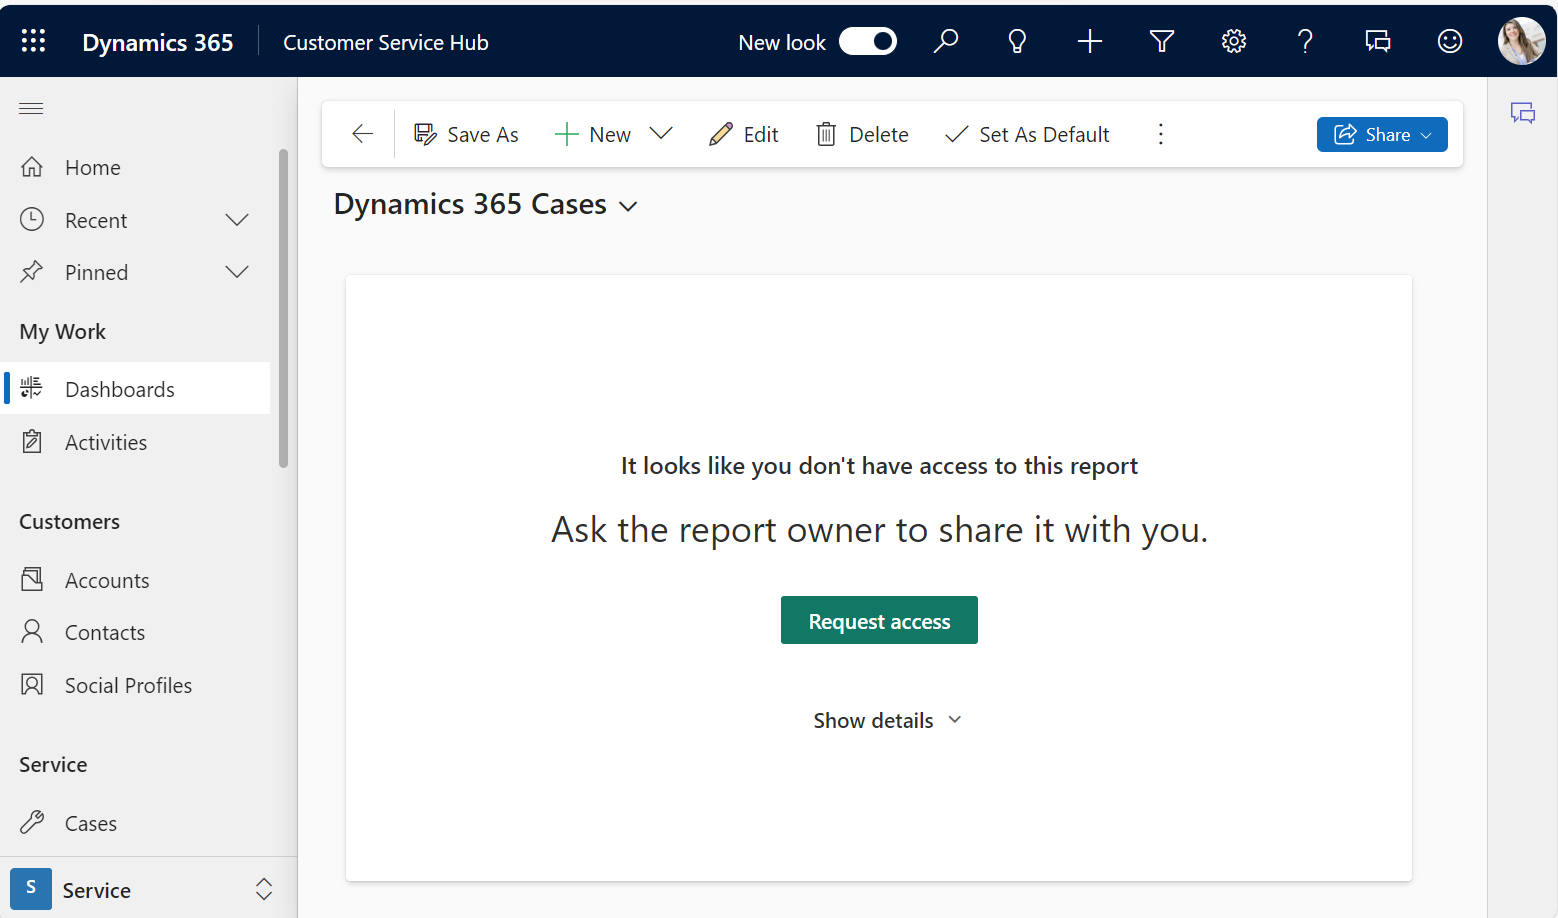
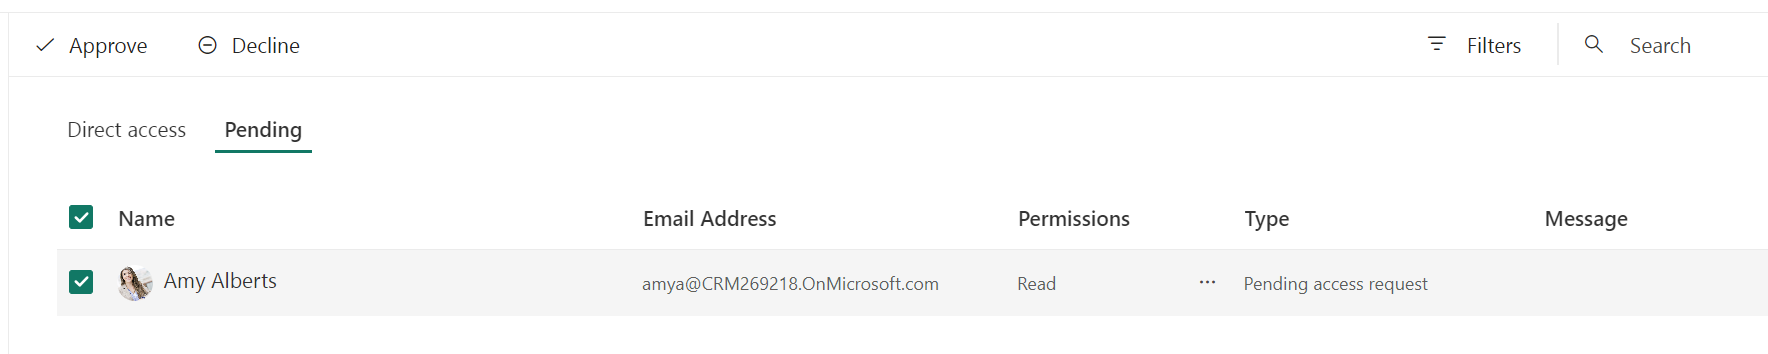
Clicking on Request access will send an email to the workspace owner, who can then approve access:
Note if you are a Power BI free user, you won’t be able to see the dashboard report, it will display an empty screen:
The other way to create a Dynamics 365 Power BI dashboard that can be more easily rolled out to an organization is through the Power Apps Maker Portal in a solution:
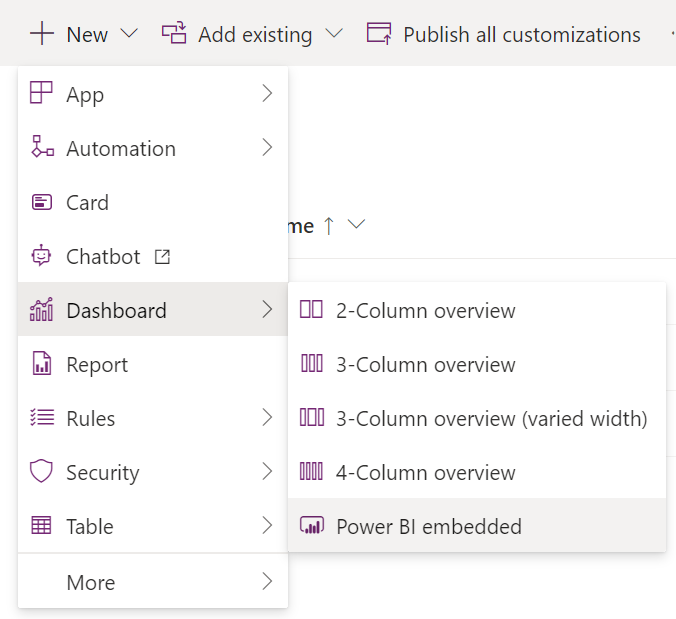
Here we can create for the solution a Power BI dashboard:
Or Power BI report:
Each of these can also be embedded in Model-Driven App navigations:
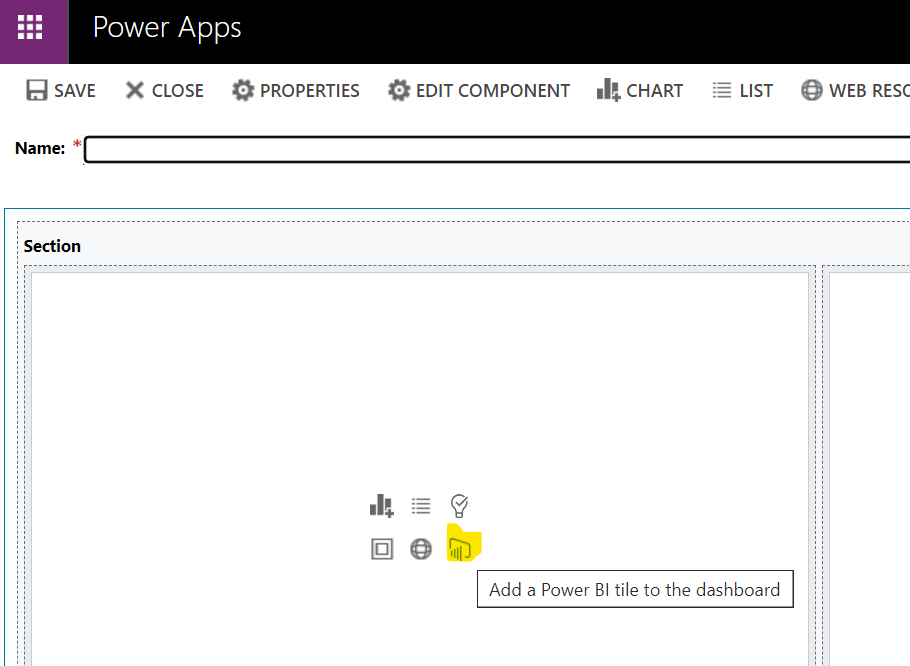
Another method for embedding is creating a Dynamics 365 dashboard:
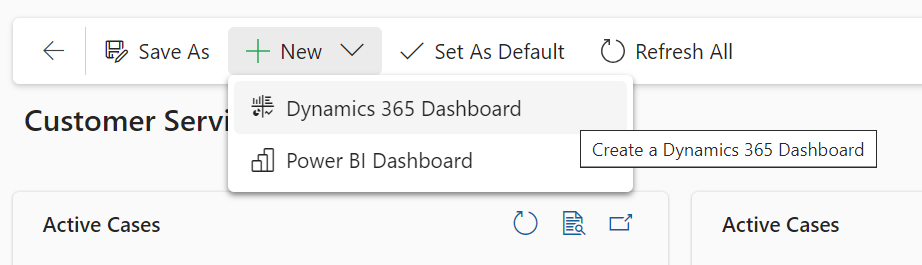
And adding a Power BI tile:
I blogged about this more here.
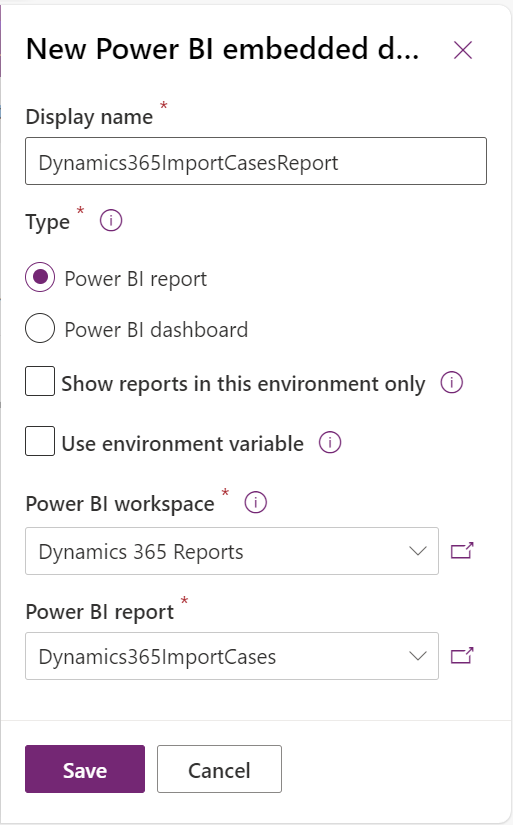
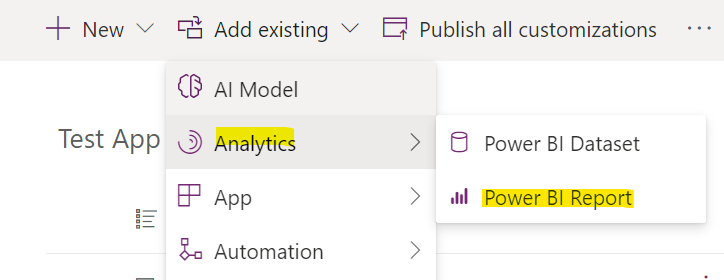
To add a Power BI report to a Dynamics 365 solution, we can add it this way through Analytics->Power BI Report:
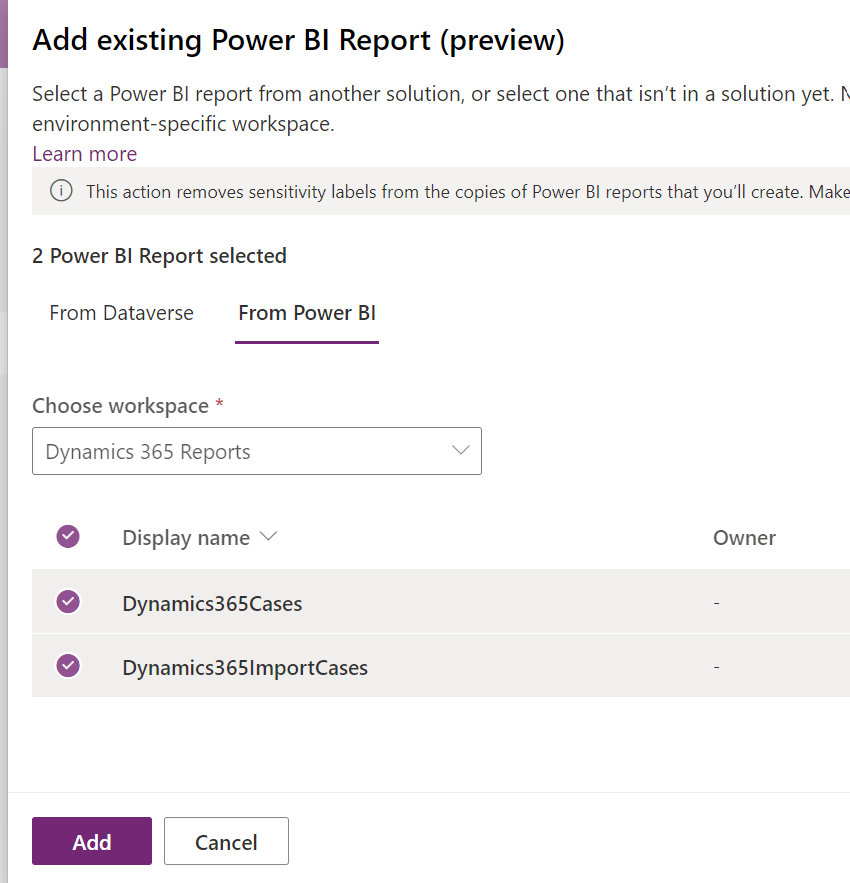
We can choose the location of the report and click Add:
What’s nice is once we add the report here, we can then embed it in Dynamics 365 forms. For example:
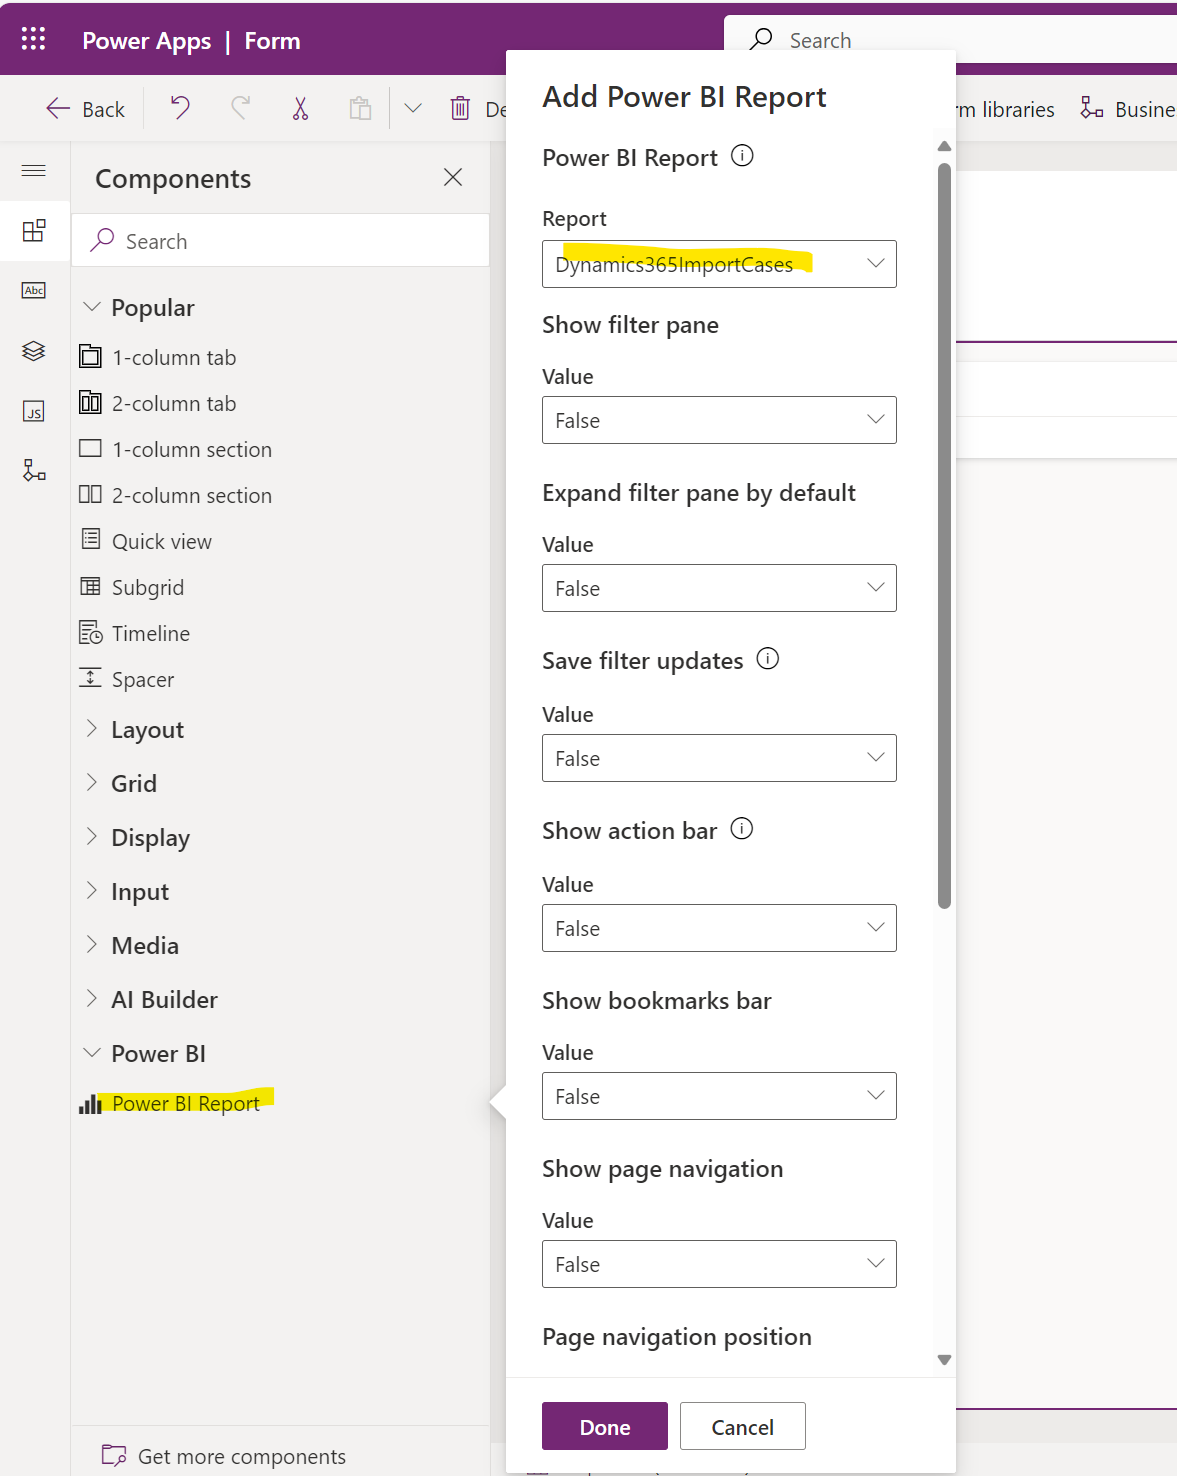
There’s quite a lot of configuration we can add here too.
Summary
As you can see, there’s tight integration with Dynamics 365 and Power BI, and the decision to use Power BI when interacting with Dynamics 365 probably depends on your specific use cases.
Here’s an overview of the differences between the options available.
| Dataverse Connector Import | Dataverse Connector DirectQuery | Azure Synapse | |
| Refresh | Up to 8 times a day scheduled refresh. May take time for refresh to complete. Better for data sets that are not very large | Real-Time | Real-Time with some lag |
| Dataverse Security observed | None. Use Row-Level security to implement your own security model | Yes, Dataverse security is applied to report user | No (needs row-level security) |
| Azure subscription | No | No | Yes |
| Complex queries | Handled through Power Query but performance can be affected | Handled through Power Query but performance can be affected | Data Warehouse |
| Performance | For non-large datasets without complex queries, report performance is good (runs off cached data) | May depend on environment and data model and optimizing report, may also affect Dataverse | Designed for large datasets |
UPDATE: Link to Microsoft Fabric is another option that makes all your Dataverse data available in OneLake. All your data stays in the Dataverse and and consumes Dataverse storage, as opposed to Azure Synapse Link which is exported to your own storage account. Hopefully I can spin up a trial at some point to do a speed test on building reports Link to Fabric reports with Power BI. Thank you Ed for calling this out in the comments.
I AM SPENDING MORE TIME THESE DAYS CREATING YOUTUBE VIDEOS TO HELP PEOPLE LEARN THE MICROSOFT POWER PLATFORM.
IF YOU WOULD LIKE TO SEE HOW I BUILD APPS, OR FIND SOMETHING USEFUL READING MY BLOG, I WOULD REALLY APPRECIATE YOU SUBSCRIBING TO MY YOUTUBE CHANNEL.
THANK YOU, AND LET’S KEEP LEARNING TOGETHER.
CARL